|

Ripple Price Analysis: XRP/USD keeps trending horizontally in the lower part of 20-day Bollinger Band

  • XRP/USD bulls wrest control from the bears this Wednesday.
  • The MACD shows decreasing bearish momentum.
  • The Elliott Oscillator has had two straight green sessions.

XRP/USD daily chart

XRP/USD daily chart

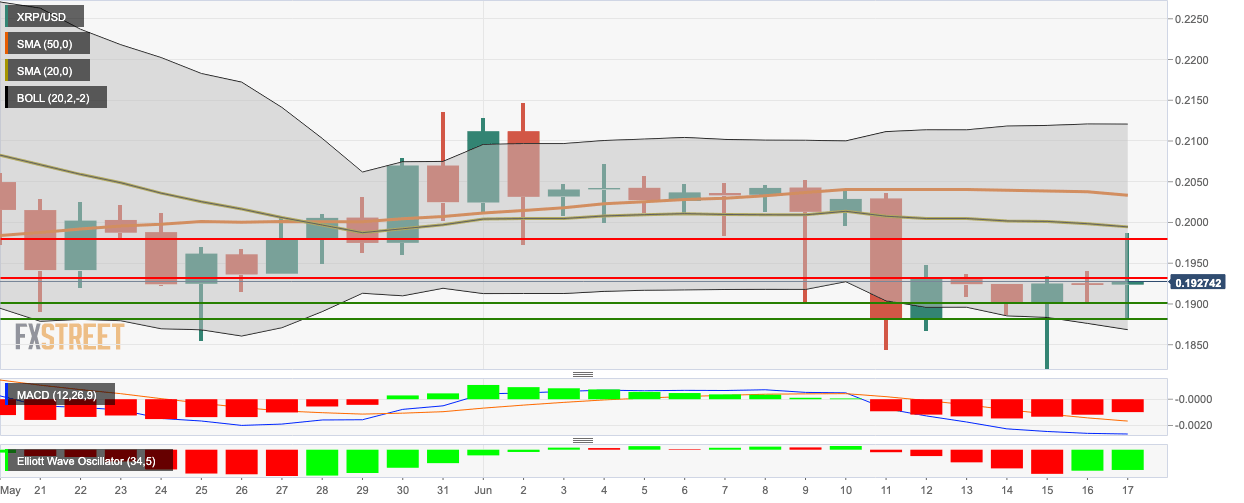
XRP/USD went up from $0.1923 to $0.1926 this Wednesday as the bulls took back control after a bearish Tuesday. The price is trending horizontally in the lower half of the 20-day Bollinger Band and struggling to break above the $0.1933 resistance level. The MACD shows decreasing bearish market momentum, while the Elliott Oscillator has had two consecutive green sessions.

Support and Resistance

XRP/USD faces strong resistance at $0.1933, $0.198, SMA 20 and SMA 50. On the downside, there are healthy support levels at $0.19 and $0.18825.

Key levels

XRP/USD

Overview
Today last price0.1926
Today Daily Change0.0003
Today Daily Change %0.16
Today daily open0.1923
 
Trends
Daily SMA200.1999
Daily SMA500.2038
Daily SMA1000.191
Daily SMA2000.2121
 
Levels
Previous Daily High0.1941
Previous Daily Low0.19
Previous Weekly High0.2053
Previous Weekly Low0.1844
Previous Monthly High0.2268
Previous Monthly Low0.178
Daily Fibonacci 38.2%0.1916
Daily Fibonacci 61.8%0.1925
Daily Pivot Point S10.1902
Daily Pivot Point S20.1881
Daily Pivot Point S30.1862
Daily Pivot Point R10.1943
Daily Pivot Point R20.1962
Daily Pivot Point R30.1983


Author

Rajarshi Mitra

Rajarshi Mitra

Independent Analyst

Rajarshi entered the blockchain space in 2016. He is a blockchain researcher who has worked for Blockgeeks and has done research work for several ICOs. He gets regularly invited to give talks on the blockchain technology and cryptocurrencies.

More from Rajarshi Mitra
Share:

Editor's Picks

 Top 3 Price Prediction: BTC consolidates gains, ETH defends support, XRP nears breakout trigger

Bitcoin, Ethereum and Ripple begin the week on a constructive note as the top three cryptocurrencies attempt to extend rebounds after recovering nearly 4%, 2% and 2.6%, respectively. BTC steadies around $65,600, ETH continues to hold firmly above the key $1,700 support, while XRP nears the upper boundary of the falling channel pattern.

Ethereum Price Forecast: ETH struggles below $1,700 amid subdued on-chain users and capital outflows

Ethereum rises, albeit gradually, toward $1,700. The smart contract token reflects a marginal increase in buyers seeking to re-engage at lower price levels, following the massive drawdown from mid-May, which was largely driven by geopolitical tensions in the Middle East and macroeconomic uncertainty.

XRP clings to support as derivatives interest cools

Ripple hangs on to $1.14 support, extending its rebound from its early-week support at $1.10 and June’s low of $1.05. Maintaining this short-term support level is vital for the remittance token to preserve its bullish momentum, with a decisive breakout above $1.20 likely to signal further upside potential.

Crypto Today: Bitcoin, Ethereum, XRP recovery slows amid incessant capital outflows
The cryptocurrency remains in a broader corrective bias on Friday, despite majors such as Bitcoin (BTC), Ethereum (ETH), and Ripple (XRP) holding slightly higher than early-week support levels. Bitcoin hovers around $63,500 amid a capped upside. Ethereum eyes a breakout past $1,700, while XRP hovers above $1.40.
Experts agree: Bitcoin nears bottom, but weak demand raises doubts
Bitcoin (BTC) is trading above $63,000 at the time of writing on Friday after rebounding from the key 200-week Simple Moving Average (SMA) near $62,000, a level widely viewed as key long-term support. The recovery may suggest that Bitcoin has found a floor after a sharp correction that spanned more than a month, but some warning signs persist.