Ripple Price Analysis: XRP/USD continues its fall as price looks to break below SMA 50
- XRP/USD has dropped by >6% over the last nine days.
- The MACD shows decreasing bullish market momentum.

XRP/USD daily chart
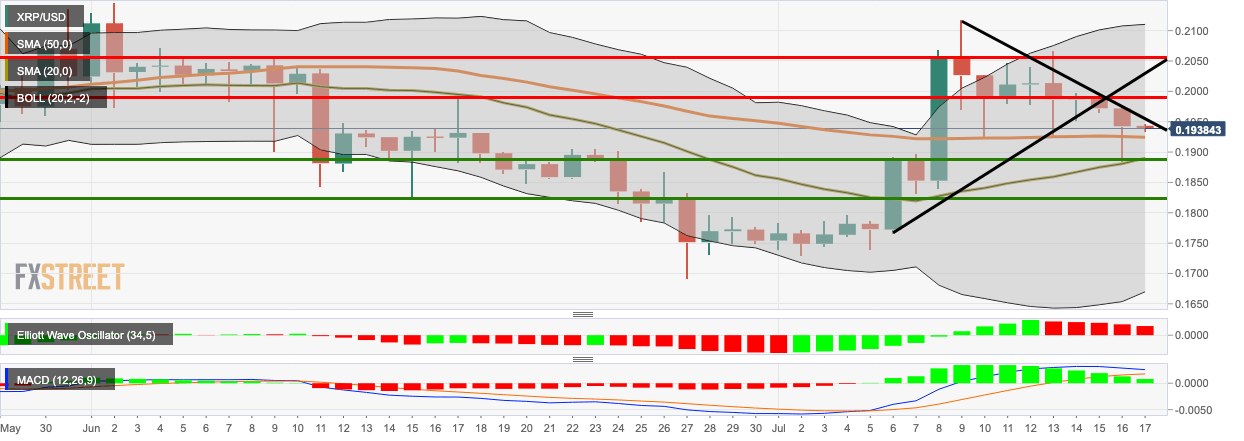
Ripple bears stayed in control for the third straight day. XRP/USD is priced at $0.194 and looks to drop below the SMA 50. The price has fallen below the triangle formation and is hugging along the downward trending line. XRP/USD has lost more than 6% of its valuation over the last nine days.
The Elliott Oscillator has had five straight red sessions, while the MACD shows decreasing bullish momentum. All these indicators show that the overall market sentiment is presently bearish.
Support and Resistance
XRP/USD has two strong resistance levels at $0.199 and $0.206. On the downside, there three healthy support levels at $0.193 (SMA 50), $0.1891 (SMA 50) and $0.1822.
Key levels
Author

Rajarshi Mitra
Independent Analyst
Rajarshi entered the blockchain space in 2016. He is a blockchain researcher who has worked for Blockgeeks and has done research work for several ICOs. He gets regularly invited to give talks on the blockchain technology and cryptocurrencies.


