|

Ripple Price Analysis: XRP/USD bulls look to break above the triangle formation

  • XRP/USD went up from $0.1807 to $0.1908 this Thursday.
  • The price broke above the SMA 20 and SMA 50 curves following Thursday’s price action.

XRP/USD daily chart

XRP/USD daily chart

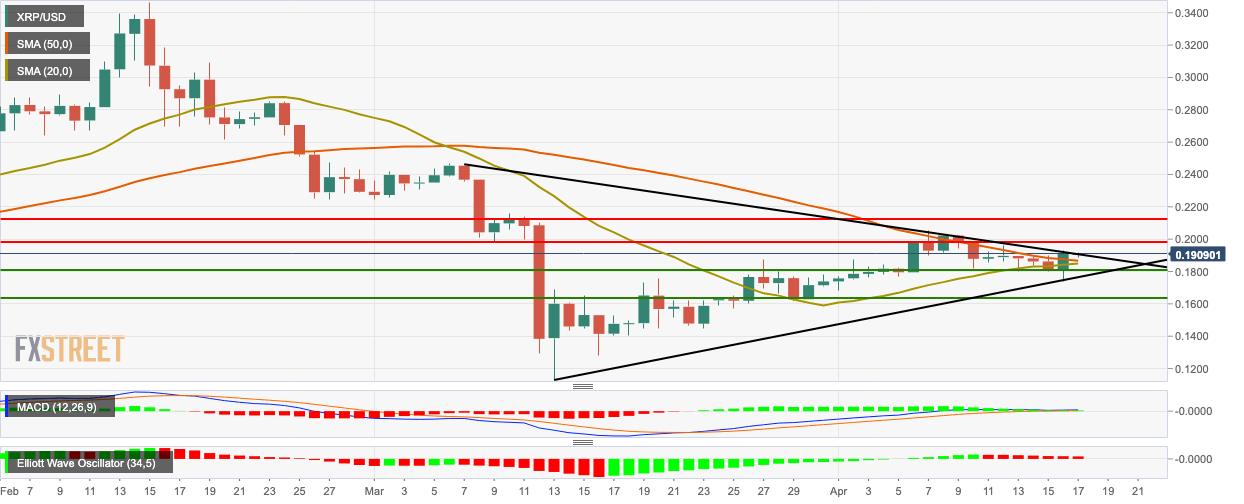
XRP/USD bulls retained control in the early hours of Friday as the price went up slightly from $0.1908 to $0.1910. This Thursday, the price flew up from $0.1807 to $0.1908 and broke above the SMA 20 and SMA 50 curves. The SMA 20 is also looking to crossover the SMA 50 to chart a bullish cross pattern. The bulls will want to break above the triangle formation and aim for the $0.1987 resistance level. The MACD indicates decreasing bullish momentum, while the Elliott Oscillator has had seven straight red sessions.

XRP/USD hourly chart

XRP/USD hourly chart

The hourly price struggled to break above the $0.19087 resistance level before it finally managed to do so. However, it then ran out of steam at the $0.1924 line and dropped back below the $0.19087 line. The 20-day Bollinger jaw has narrowed considerably, indicating decreasing price volatility. The SMA 20 has crossed over the SMA 200 to chart a bullish cross pattern.

Key levels

XRP/USD

Overview
Today last price0.1902
Today Daily Change-0.0007
Today Daily Change %-0.37
Today daily open0.1909
 
Trends
Daily SMA200.1842
Daily SMA500.1875
Daily SMA1000.221
Daily SMA2000.2331
 
Levels
Previous Daily High0.1933
Previous Daily Low0.1741
Previous Weekly High0.2053
Previous Weekly Low0.1767
Previous Monthly High0.2468
Previous Monthly Low0.1129
Daily Fibonacci 38.2%0.186
Daily Fibonacci 61.8%0.1814
Daily Pivot Point S10.1789
Daily Pivot Point S20.1669
Daily Pivot Point S30.1598
Daily Pivot Point R10.1981
Daily Pivot Point R20.2052
Daily Pivot Point R30.2172


Author

Rajarshi Mitra

Rajarshi Mitra

Independent Analyst

Rajarshi entered the blockchain space in 2016. He is a blockchain researcher who has worked for Blockgeeks and has done research work for several ICOs. He gets regularly invited to give talks on the blockchain technology and cryptocurrencies.

More from Rajarshi Mitra
Share:

Editor's Picks

Crypto Today: Bitcoin at $60,000, Ethereum at $1,500, and XRP at $1 face a make-or-break test

Bitcoin (BTC), Ethereum (ETH), and Ripple (XRP) are trading in the red on Friday after three consecutive days of losses, testing their respective make-or-break support levels.

Bitcoin Weekly Forecast: BTC hits 20-month low, will the pain continue?

Bitcoin recovers slightly, trading at $66,000 on Friday after reaching a new yearly low of $58,115 earlier this week, its lowest level since October 2024. Institutional selling intensified as spot ETFs recorded $1.35 billion in net outflows through Thursday.

XRP clings to $1 as long liquidations deepen bearish trend

Ripple trades near the key psychological support level of $1 at the time of writing on Friday after losing more than 8% so far this week. CoinGlass liquidation data shows that over 97% XRP long positions were wiped out over the past 24 hours.

Pi Network Price Forecast: Minor recovery amid market crash fuels short-term hope

Pi Network price records a mild 3% recovery at press time on Friday, shaping a rebound from a broken descending trendline. The declining trend in trading volume has stabilized around $10 million this week, supporting the possibility of an extended recovery as selling pressure wanes.

Bitcoin: BTC hits 20-month low, will the pain continue?
Bitcoin (BTC) recovers slightly, trading at $66,000 on Friday after reaching a new yearly low of $58,115 earlier this week, its lowest level since October 2024. Institutional selling intensified as spot Exchange Traded Funds (ETFs) recorded $1.35 billion in net outflows through Thursday.