Ripple Price Analysis: XRP ready for breakout, potential 41% moves on the cards
- XRP may be ready for another bullish wave with the target at $0.89.
- If the price breaks below $0.58, it will invalidate the bullish forecast.

Ripple's XRP has had one of the best months in history as the third-largest digital asset price jumped by over 300%, from $0.22 and tested $0.82. the highest level since May 2018. At the time of writing, XRP/USD is changing hands at $0.61, mostly unchanged on a day-to-day and week-to-week basis.
Ripple's market value settled at $27.9 billion, while its average daily trading volume is registered at $10 billion, down from the record high of $30 billion on November 24.
XRP's on-chain metrics promise more growth
Ripple's daily active addresses spiked to the record high of 41,599 during the rally at the end of November. By the time of writing, the number has dropped to less than 20,000 amid subsiding market volatility. However, it is still significantly higher than the year average.
%20[12.14.28,%2007%20Dec,%202020]-637429316726187740.png)
Ripple's daily active addresses
Daily active addresses (DAA) is a famous on-chain metric that helps estimate users' network activity. It refers to the number of addresses that participated in a transaction on a given day. Each address is counted only, making this metric more accurate than a transaction count.
DAA allows access to how active a given blockchain is. The growing number is regarded as a bullish signal as it implies that the coin is being actively used.
XRP stuck in a symmetrical triangle
From the technical point of view, XRP moves inside a symmetrical triangle formation, characterized by sloping and upward-looking trend lines connecting a series of sequential peaks and bottoms. This continuation pattern results from a consolidation period after a sharp price movement that denotes a sense of uncertainty on the market. The direction of the breakout will define further momentum.
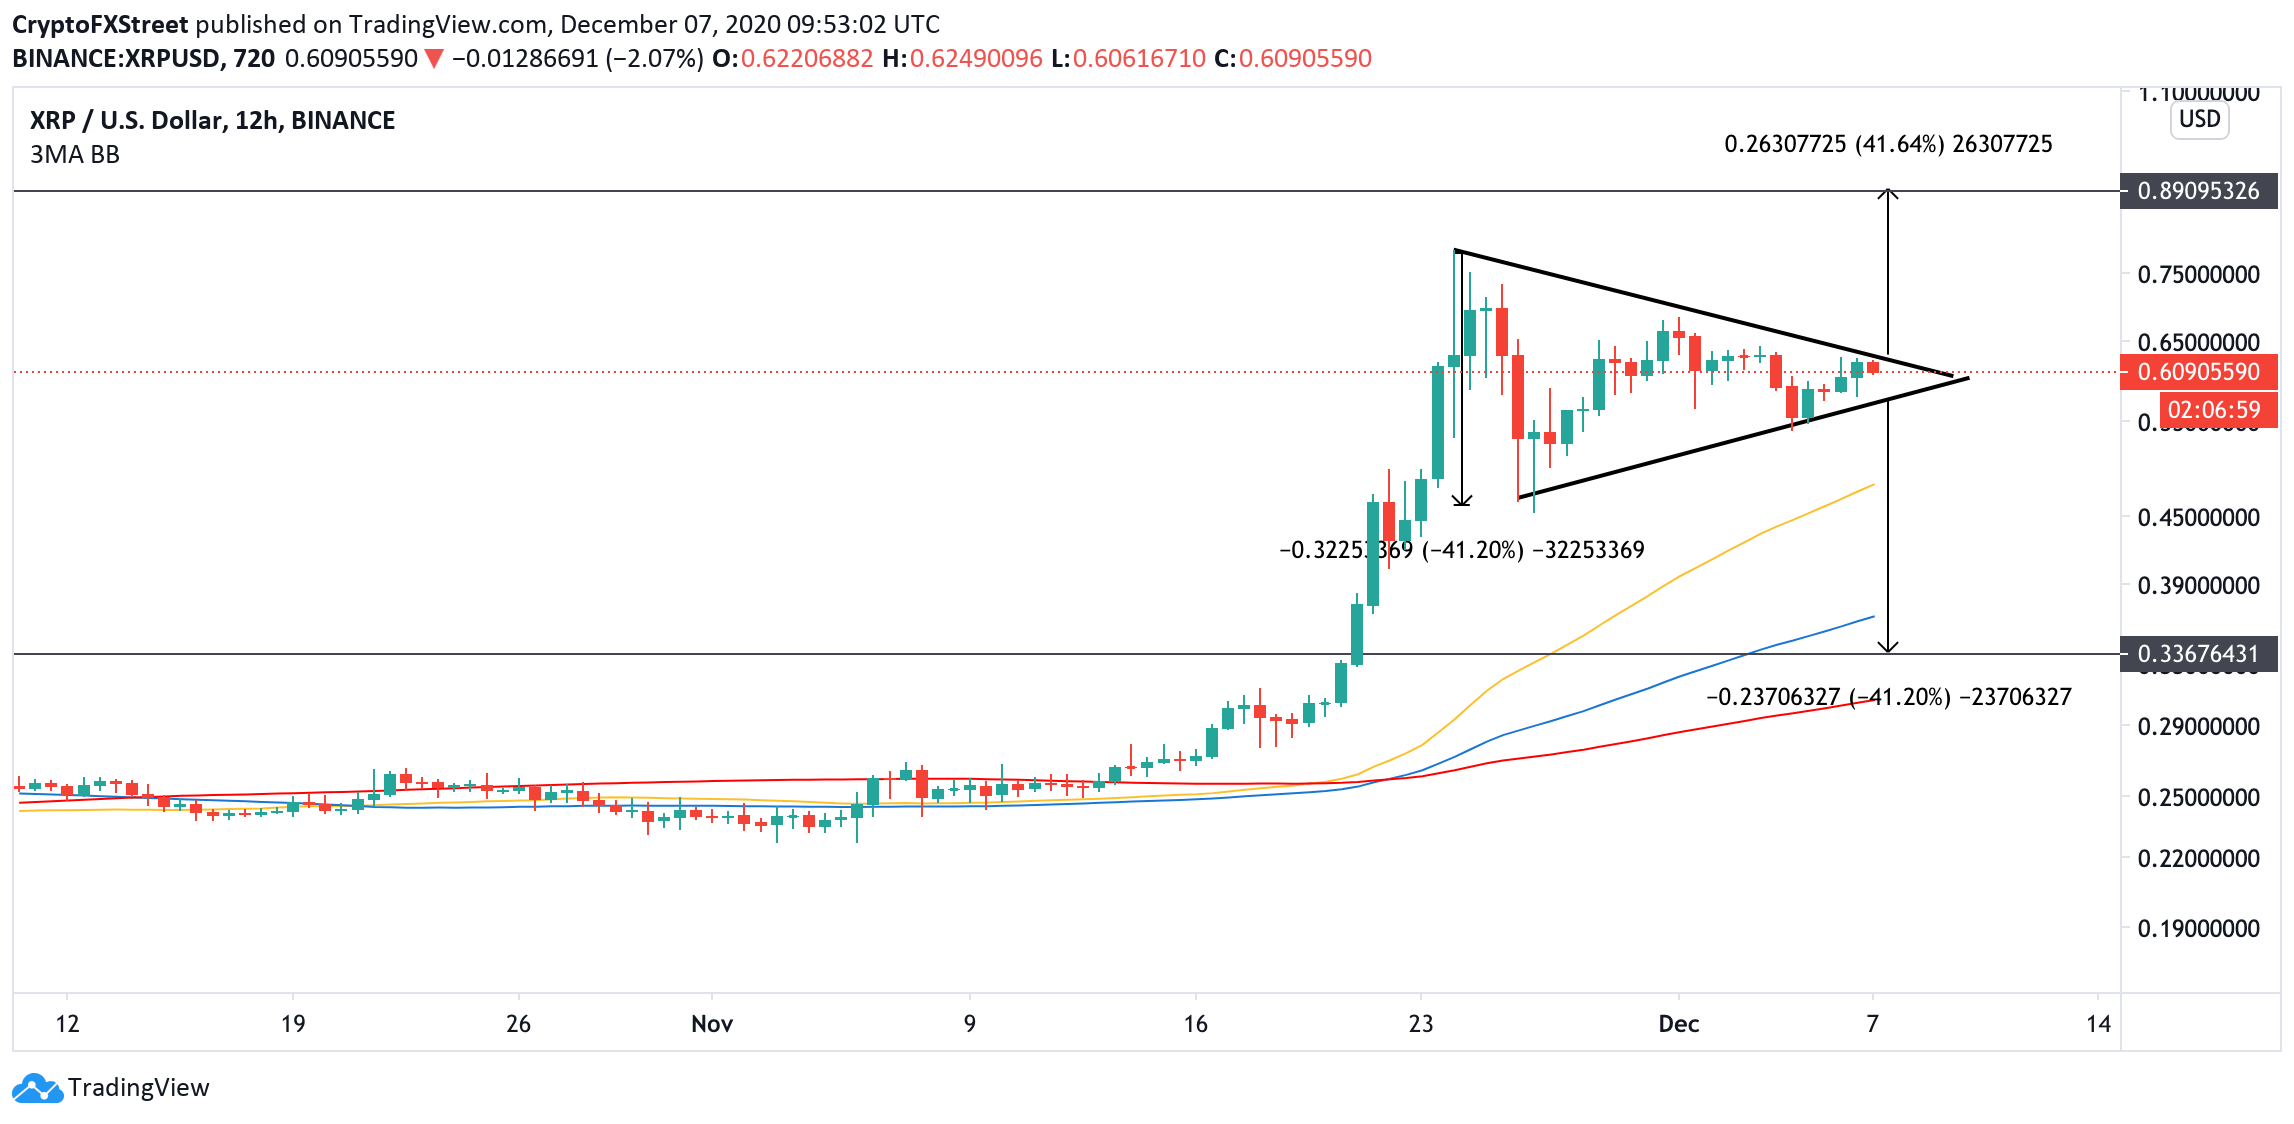
XRP's 12-hour chart
The bullish development will be confirmed by a candlestick closing above the falling trendline resistance at $0.62. In this case, the upside momentum may gain traction, with the estimated target at $0.89. This target represents a 41% price increase. It is determined by measuring the distance between the widest point of the triangle and the potential breakout point.
On the other hand, following a similar reasoning, a sustainable move below the triangle support at $0.58 will result in a substantial decline towards $0.336. This development will invalidate the immediate bullish forecast and bring more bears to the market.
Author

Tanya Abrosimova
Independent Analyst


