XRP is a burden for Ripple – expert opinion
- XRP/USD recovery capped by the psychological level $0.2000.
- Bloomberg's Mike McGlone believes that XRP exposure is a risk for Ripple.

Ripple's XRP hit the intraday high at $0.1997 as the cryptocurrency market resumed the recovery during early Asian hours. However, by press time, XRP retreated to $0.1977 to trade unchanged since the beginning of the day. Since this time on Sunday, the coin has gained over 1%. Ripple's XRP is the third-largest digital asset with the current market value of $8.7 billion and an average daily market trading volume of $1.8 billion.
XRP exposure threatens Ripple's cross-border payments venture
According to Bloomberg Intelligence Senior Commodity Strategist, Mike McGlone, Ripple has the potential to disrupt the cross-border payments industry; however, the volatile nature of the cryptocurrency market may slow down the Ripple's technology adoption.
In the recent Crypto Outlook report, McGlone commented:
Ripple Labs’ 2019 partnership with MoneyGram suggests markets still see the potential for disruption in cross-border payments, yet Ripple’s exposure to its own cryptocurrency threatens its enterprise software venture. The project’s investors, including Mastercard, Visa, Capital One, Citigroup and Bank of America, are likely just hedging.
He also added that banks and financial institutions would hardly be willing to adopt blockchain infrastructure solutions for large-scale clearing, settlement and payments unless they have common standards in place and approved by regulators.
XRP/USD: Technical picture
On the intraday chart, XRP/USD is supported by the middle line of the 1-hour Bollinger Band ($0.1963) and 1-hour SMA50 (currently at $0.1950). This support area is closely followed by 1-hour SMA100 at $0.1945. Once this thick layer of barriers is cleared, the sell-off may continue towards the psychological $0.1900 that has served as a lower level of the recent consolidation range since April 23.
The downward-looking RSI on the 1-hour chart implies that the price may retest this area before another recovery attempt.
XRP/USD 1-hour chart
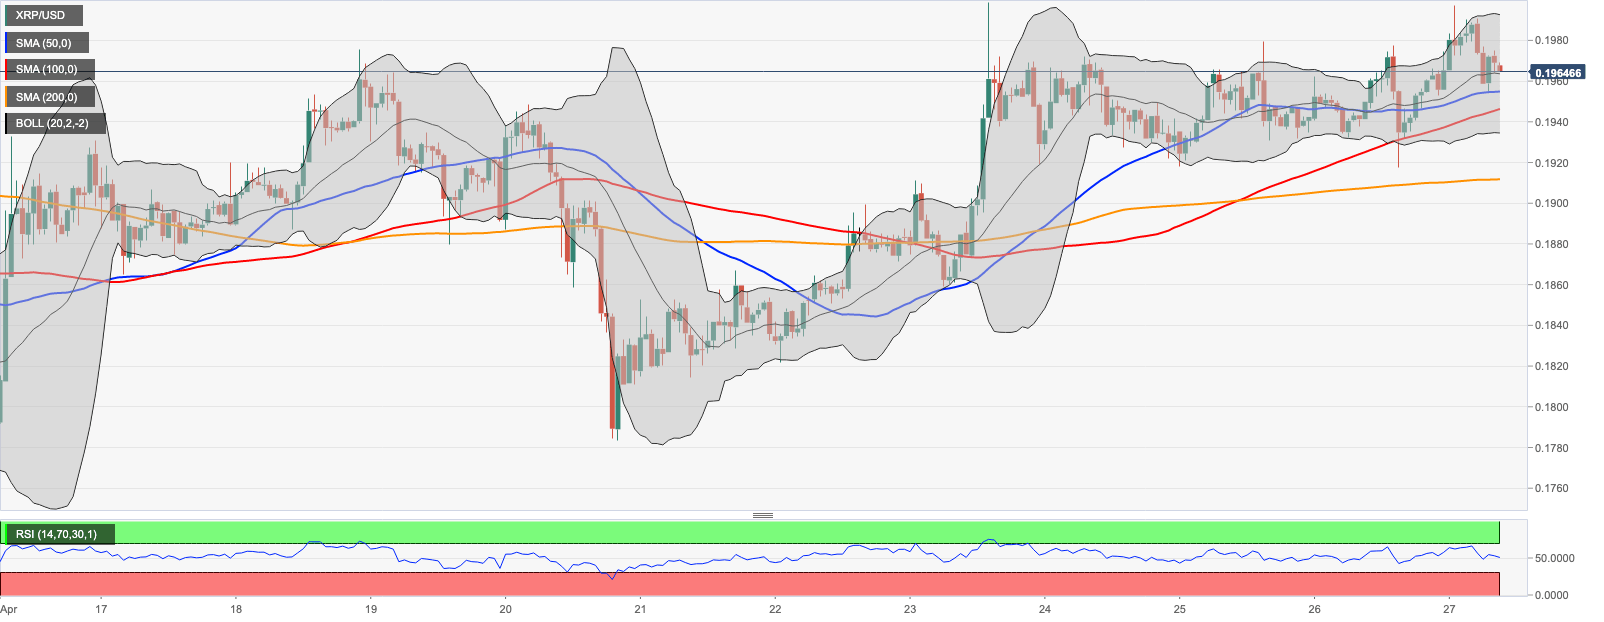
On the upside, a sustainable move above $0.2000 is needed for the upside to gain traction. This barrier coincides with the recent consolidation channel and the upper line of the daily Bollinger Band. The next resistance is created by the 23.6% Fibo retracement for the downside move from February 2020 high at $0.2130. Once it is out of the way, the upside is likely to gain traction with the next focus on $0.2100 and $0.2175 (daily SMA100).
XRP/USD daily chart
-637235761460188114.png)
Author

Tanya Abrosimova
Independent Analyst



