Render token price rally likely exhausted after a 50% two-month run for RNDR
- Render token price is up 50% since the early September low of $1.294.
- RNDR could be due for a correction, with the RSI reaching its multi-month peak.
- This bearish outlook would be invalidated if the altcoin records a three-day candlestick close above the $2.250 resistance level.

Render (RNDR) token has been on a strong recovery rally for almost two months now, with a steady price action recording higher highs and higher lows. After a successful run north, the uptrend could now be exhausted if history is enough to go by.
Also Read: RNDR Price Prediction: A 10% rise in sight for Render
Render price consolidates
Render (RNDR) is up 50% since the September 1 low of $1.294. More interestingly, it actualized the forecasted 10% gains predicted beginning October 12. However, the uptrend may now be exhausted as the Relative Strength Index (RSI) approaches its multi-month peak.
Based on the three-day chart for the RNDR/USDT trading pair below, three out of four times the RSI neared the 70 level it was rejected, deviating south in what appears to be bulls booking early profits before regrouping. With such an outlook, it is likely that traders who bought RNDR at the swing lows of $1.277, $1.474, and 1.715 may be taking early profits.
The uptrend could therefore halt, or end entirely, depending on how bulls play their hands now. If sellers have their way, Render price could break below the immediate support at $1.715, or lower to breach the $1.474 support. In the dire case, the slump could move lower to the $1.274 level. A break and close below this key support could initiate a fresh downtrend.
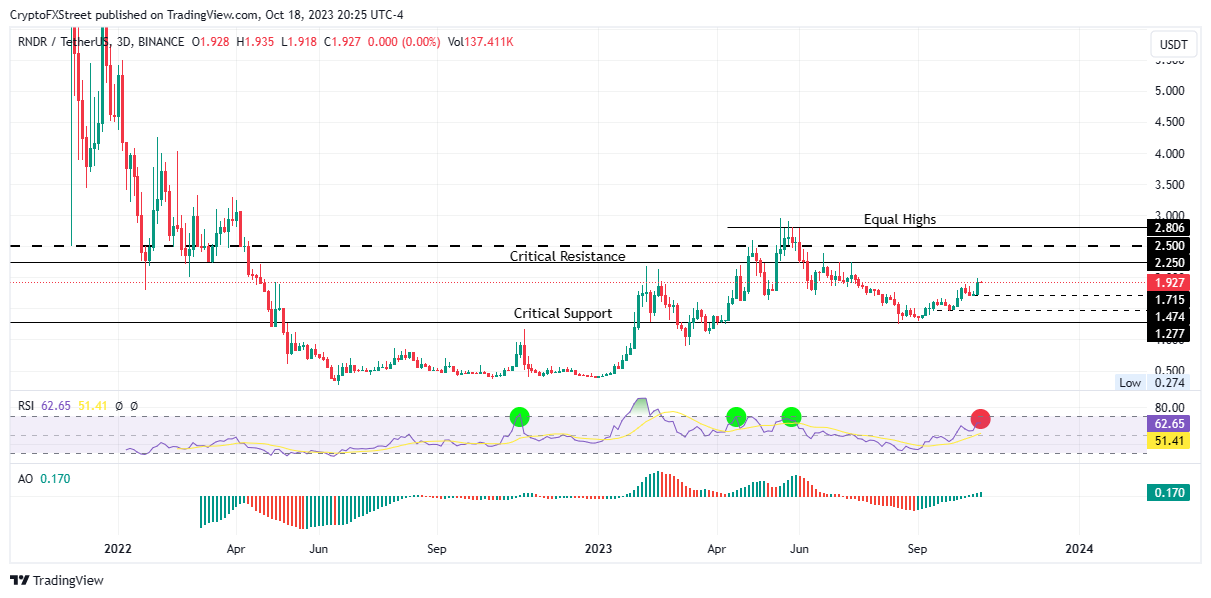
RNDR/USDT 1-day chart
Meanwhile, the odds still favor the bulls based on the technical indicators. The RSI remains above 50 to show strong momentum. In the same way, the Awesome Oscillator (AO) histogram bars are in the positive territory, flashing green and toned for more gains.
Increased buying pressure above current levels could see Render price break past the immediate hurdle at $2.250. A solid break and close above this level would invalidate the bearish outlook. However, investors looking to take long positions for RNDR should wait for confirmation above the $2.500 psychological level.
In a highly bullish case, the northbound move could extend for Render price to clear the equal highs around $2.806. Such a move would denote a 45% climb above current levels.
Author

Lockridge Okoth
FXStreet
Lockridge is a believer in the transformative power of crypto and the blockchain industry.



