Render price could climb 10% as RNDR bulls show resolve
- Render price has sustained an uptrend, leveraging strong support due to an ascending trendline.
- RNDR could extend the climb 10% to $5.50, levels last tested on January 4, 2022.
- Invalidation of the bullish thesis will occur if the price breaks and closes below $4.00.

Render (RNDR) price is trading with a bullish bias, having sustained above an ascending trendline since breaking consolidation around late September.
Also Read: AI coins Render, Akash Network, Fetch.ai rally on opening of world AI Cannes Festival
Render price could reclaim $5.50
Render (RNDR) price could clear the $5.28 range high to reach the $5.50 resistance level, 10% above the current price with the level last tested on January 4, 2022.
Amid ongoing AI crypto coin hype, RNDR bulls continue to maintain a strong presence in the market. This is evidenced by the position of large histogram bars of the Moving Average Convergence Divergence (MACD) in positive territory, as well as those of the Awesome Oscillator (AO).
The 50, 100, and 200-day Simple Moving Average (SMA) also provide support at $4.28, $3.90, and $2.80, respectively. Their inclination to the north shows this is the path with least resistance.
The MACD is still moving above its signal line (orange band), bolstering the possibility of a sustained bullish cycle. These metrics, coupled with the northbound Relative Strength Index (RSI) that shows momentum is still rising, accentuate the bullish supposition. Additionally, the position of the RSI at 64 shows there is more ground to cover to the north before RNDR can be considered overbought.
In a highly bullish case, the Render price could extrapolate the gains to tag the $6.00 psychological level, standing nearly 20% above current levels.
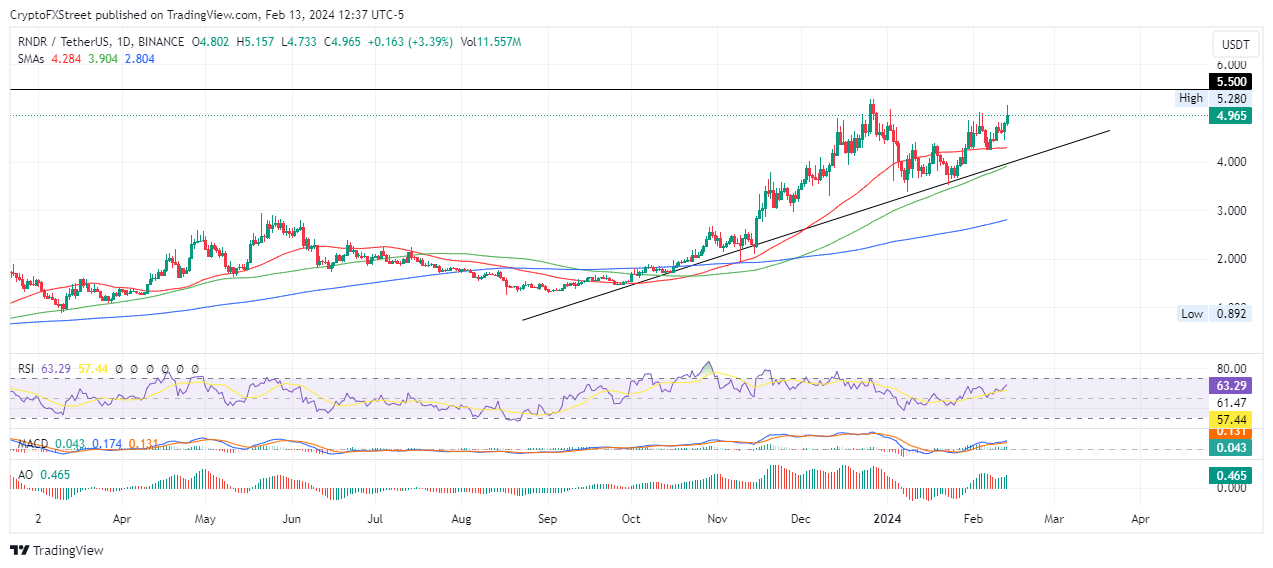
RNDR/USDT 1-day chart
On the other hand, if bears increase their selling pressure, Render price could drop below the 50-day SMA at $4.28 or slip below the ascending trendline and ultimately the 100-day SMA at $3.90. The invalidation level for the current bullish outlook is $4.00, making the 100-day SMA a confirmation of the breach.
Author

Lockridge Okoth
FXStreet
Lockridge is a believer in the transformative power of crypto and the blockchain industry.


