Ren Technical Analysis: REN uptrend hits pause despite Coinbase Pro listing
- Coinbase Pro has opened deposits for Ren ahead of the trading on October 6.
- Ren rallied to levels above $0.30 after the listing news, but a retreat is underway.

Ren pulled through with the uptrend that stalled at $0.25 mid this week. The altcoin made a blissful run above $0.30 but started to retrace, marginally below $0.31. In the meantime, the token has dived under $0.30 and is exchanging hands at $0.25. Bears seem to be gaining traction with a revisit to the 100 Simple Moving Average in the offing.
Coinbase adds trading support for Ren
The bearish outlook outlined in the price analysis on September 30 was invalidated following news that Coinbase Pro listed REN for trading. According to the blog post on October 1, REN "will be available in all Coinbase's supported jurisdictions, with the exception of New York State and the U.K." Deposit into the Coinbase Pro accounts has already been opened ahead of the trading, scheduled to begin on October 6 but only "if liquidity conditions are met." Initially, REN/USD and REN/BTC will be the only supported trading pairs.
Ren resumes the downtrend
The news regarding listing on Coinbase mainly fueled ren uptrend. As the information settled, a retracement lurked on the horizon. For instance, the token was rejected at the ascending parallel channel upper boundary. The retreat is highlighted by the Relative Strength Index (RSI) after hitting a wall at the overbought area. Declines are likely to continue as long as the RSI remains in the downtrend towards the midline.
REN/USD 4-hour chart
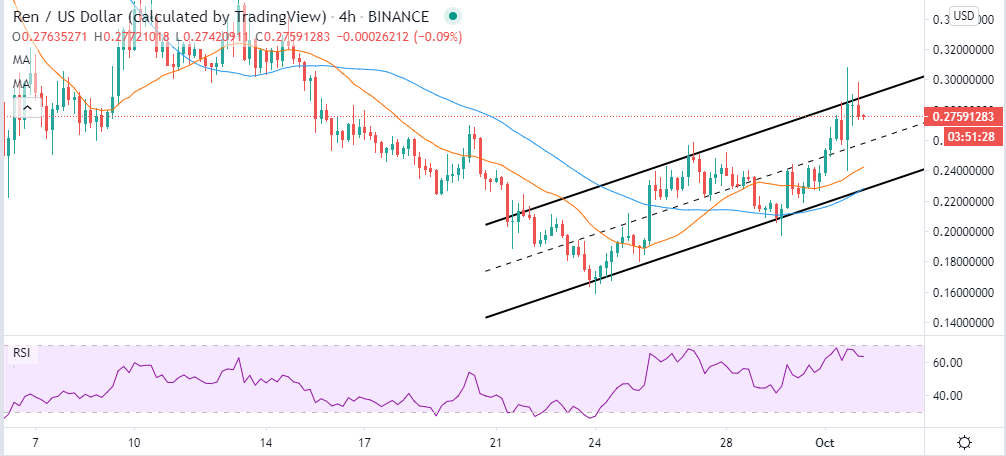
On the downside, the channel's middle boundary is in line to offer support. However, if the support is shattered, we can expect the bearish leg to extend to the 100 Simple Moving Average (SMA) or $0.22. REN could revisit the channel's lower boundary and the 50 SMA before a significant reversal comes into the picture.
IntoTheBlock's IOMAP model reveals a relatively smooth ride to the crucial resistance between $0.29 and $0.30. Previously, 241 addresses purchased approximately 21 million REN in this range. The zone could absorb the buying pressure, but if it is flipped into support, Ren will gain traction to levels above $0.31.
Ren IOMAP chart
-637372223685849937.png)
On the flip side, Ren is resting on areas with immense support. The strongest of the multiple support zones lie between $0.25 and $0.26. Here, around 100 addresses previously purchased nearly 40 million REN. This zone's buying pressure is likely to cushion REN from plunging further and even set it on a recovery path.
The number of new addresses joining the network is also on an uptrend based on on-chain data by IntoTheBlock. Since September 29, new addresses joining the network have surged from 95 to 339. The number is likely to grow amid the listing on Coinbase. The increase can be considered as a significant bullish sign for REN in the near term.
Ren new addresses chart
-637372224075243803.png)
Looking on the other side of the fence
The selling pressure is not unique to Ren seems to be rampant in the cryptocurrency market. Ren rallied following the news that Coinbase Pro will be supporting the buying and selling of two pairs; REN/USD and REN/BTC. If the trading starts on Tuesday as scheduled, the crypto could revive the uptrend. Moreover, if REN holds above the channel's middle boundary, the bearish outlook could be invalidated. A move that could see bulls shift the focus back to $0.30.
Author

John Isige
FXStreet
John Isige is a seasoned cryptocurrency journalist and markets analyst committed to delivering high-quality, actionable insights tailored to traders, investors, and crypto enthusiasts. He enjoys deep dives into emerging Web3 tren



