PUMP, XDC, FORM post double-digit gains as Ethereum’s rally targets $4,000

- Pump.fun bounces off a local support to break out of a falling channel, with bulls targeting $0.0030.
- XDC Network holds at the $0.1000 psychological level after a 12% surge.
- Four records a new all-time high within a rising wedge pattern following the 11% jump on Tuesday.
PUMP breakout rally aims to surpass $0.0030
PUMP records nearly 15% gains on Tuesday to break out of a descending broadening wedge on the 4-hour chart. At the time of writing, the meme coin launchpad token edges lower by nearly 2% as it faces overhead pressure near the $0.0030 round figure.
The altcoin is forming a potential range between horizontal levels of $0.0023 and $0.0030. A potential breakout above the $0.0030 ceiling could extend the rally to $0.0037 level, marked by the June 19 low.
The Moving Average Convergence Divergence (MACD) and its signal line remain in a downtrend but flash a neutral signal as it remains below the zero line. Investors could consider the resurfacing of average lines above the zero line as a buy signal.
The Relative Strength Index (RSI) reads 51 on the 4-hour chart following a bounce back from the oversold level, indicating a resurgence in buying pressure. However, the RSI remains neutral as it holds at the midpoint.
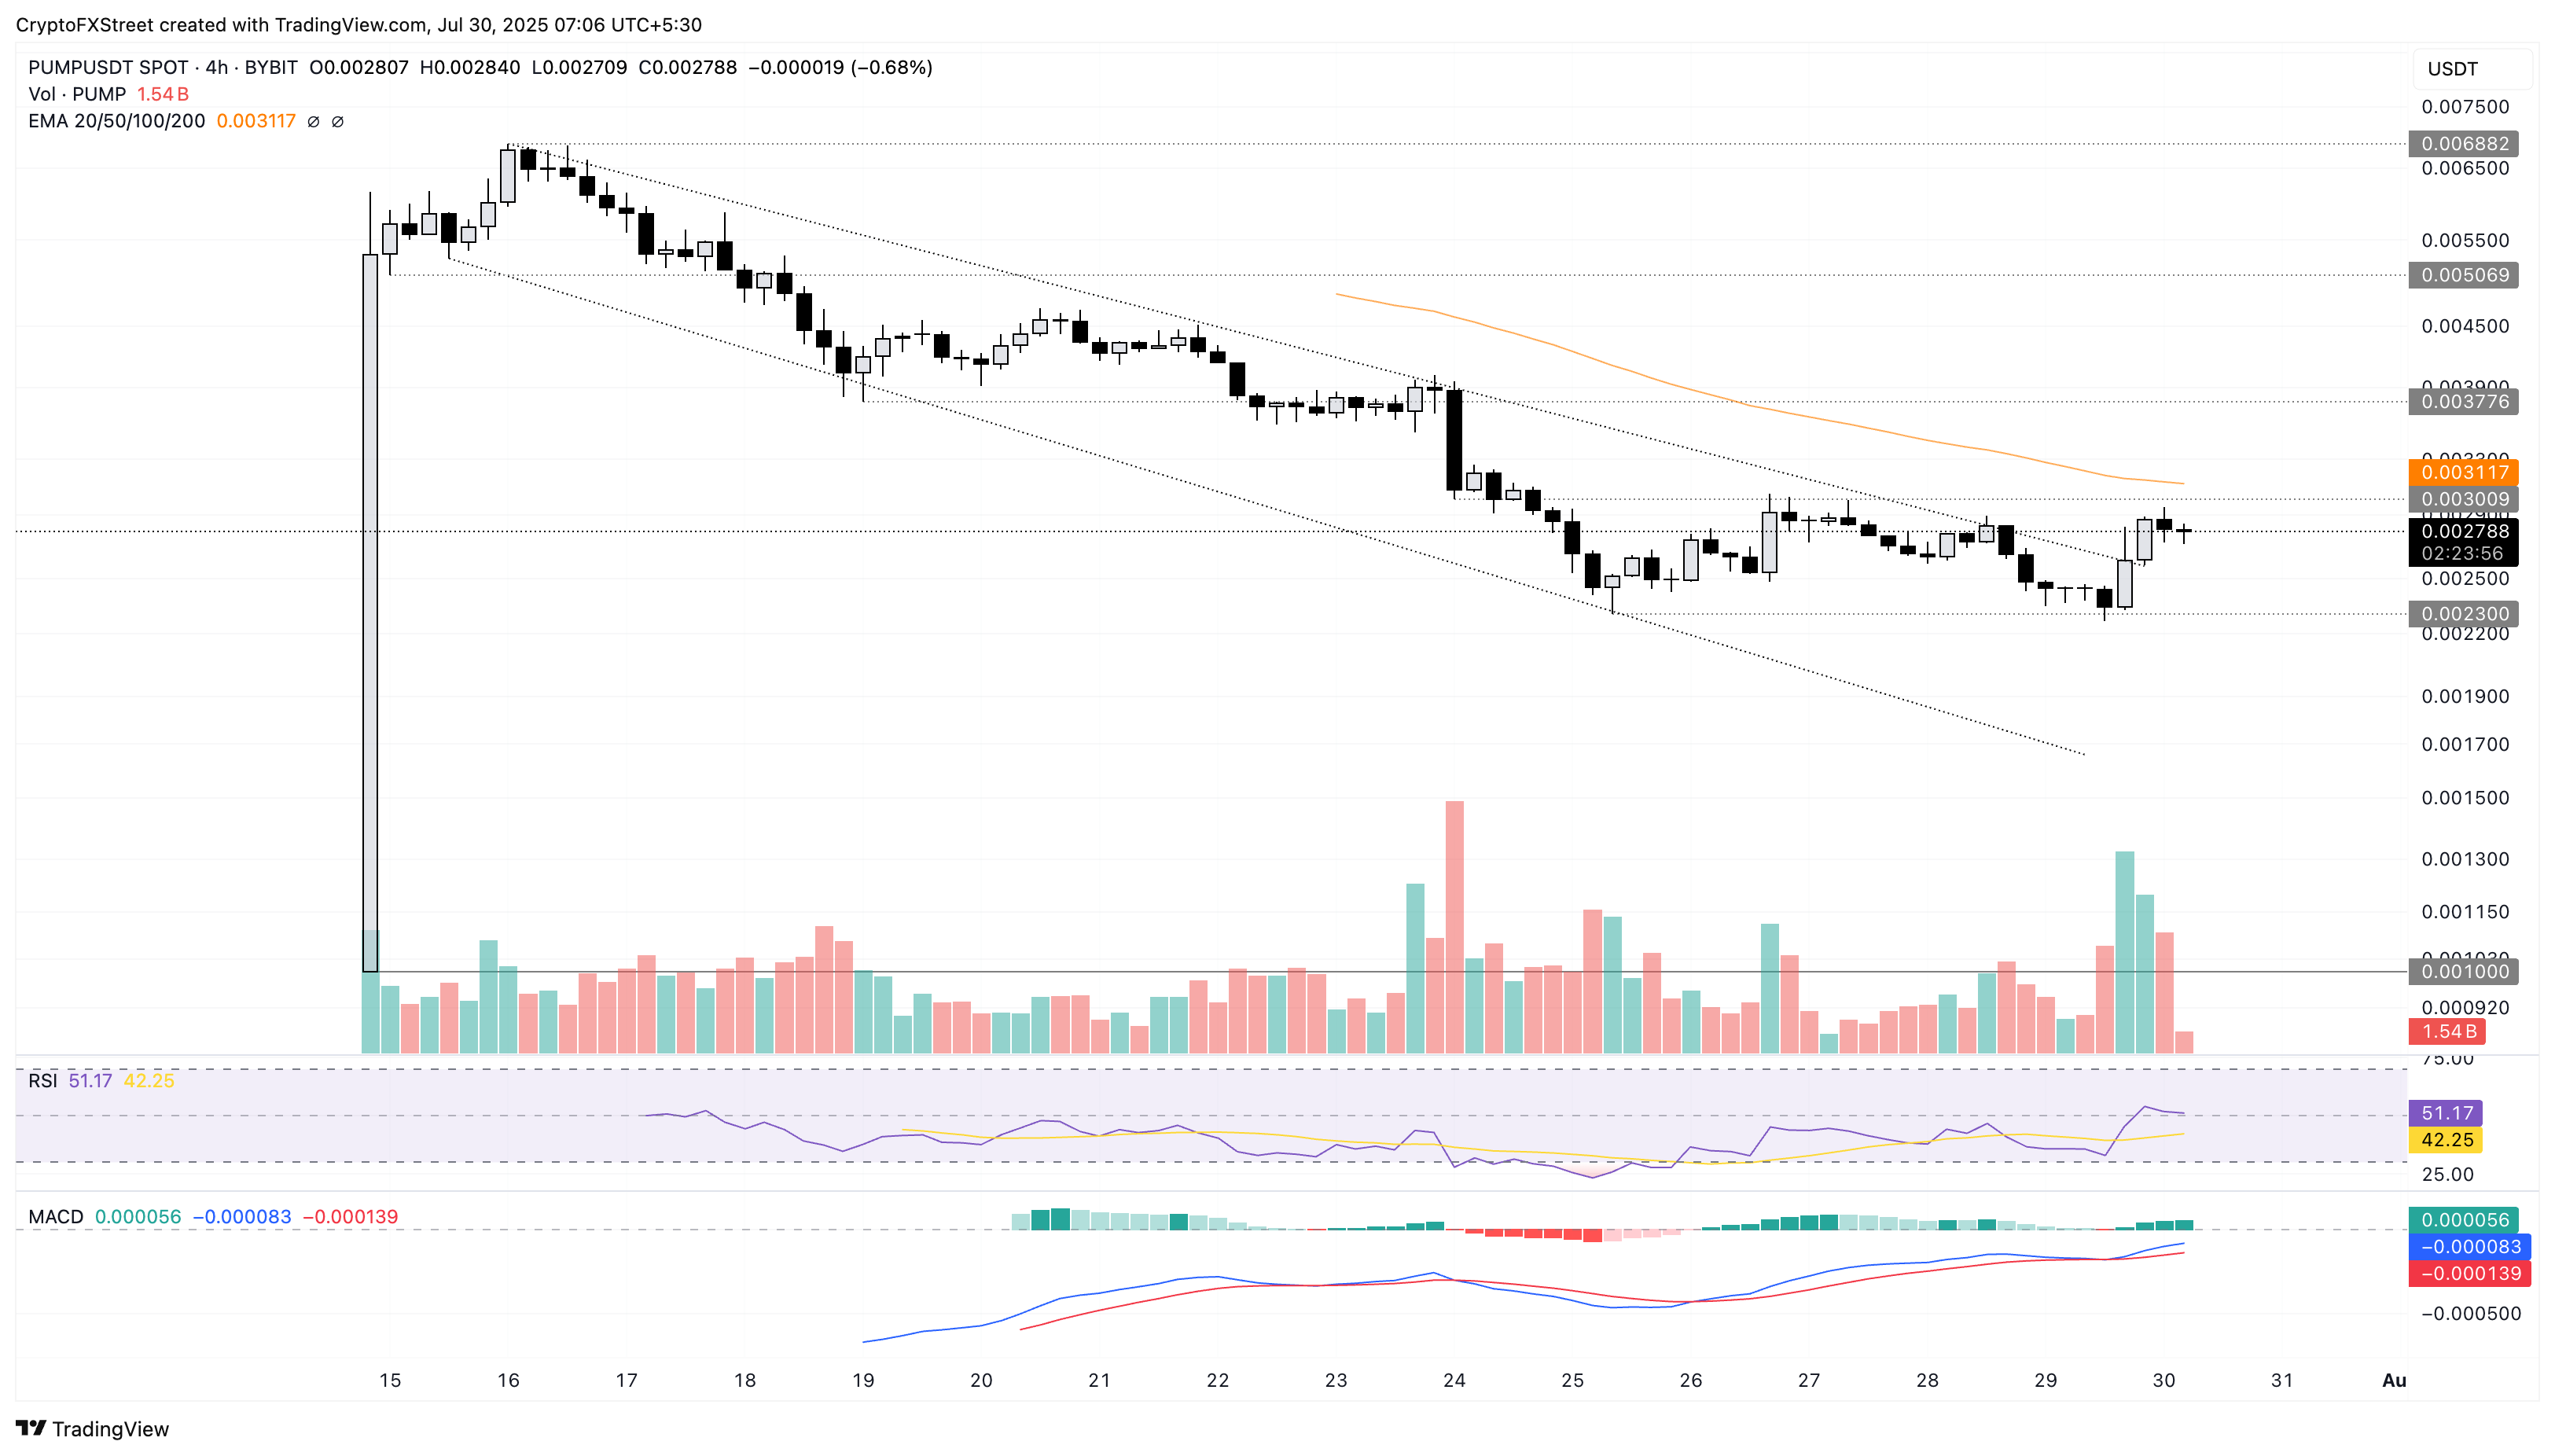 PUMP/USDT daily price chart.
On the flip side, a reversal in PUMP could retest the $0.0023 support level.
XDC hovers at $0.10, aiming for extended gains
XDC Network edges higher to hold at the $0.100 psychological level at press time on Wednesday, following the 12% gains from the previous day. Price action has displayed a quick V-shaped reversal in XDC over the last week, from the $0.083 support level.
A clean push above the $0.10 level could extend the recovery run to $0.116 level on January 28.
The MACD indicator flashes an indecisive signal as the MACD and signal line remain merged. Still, the RSI edges higher toward the overbought boundary, indicating an increase in buying pressure.
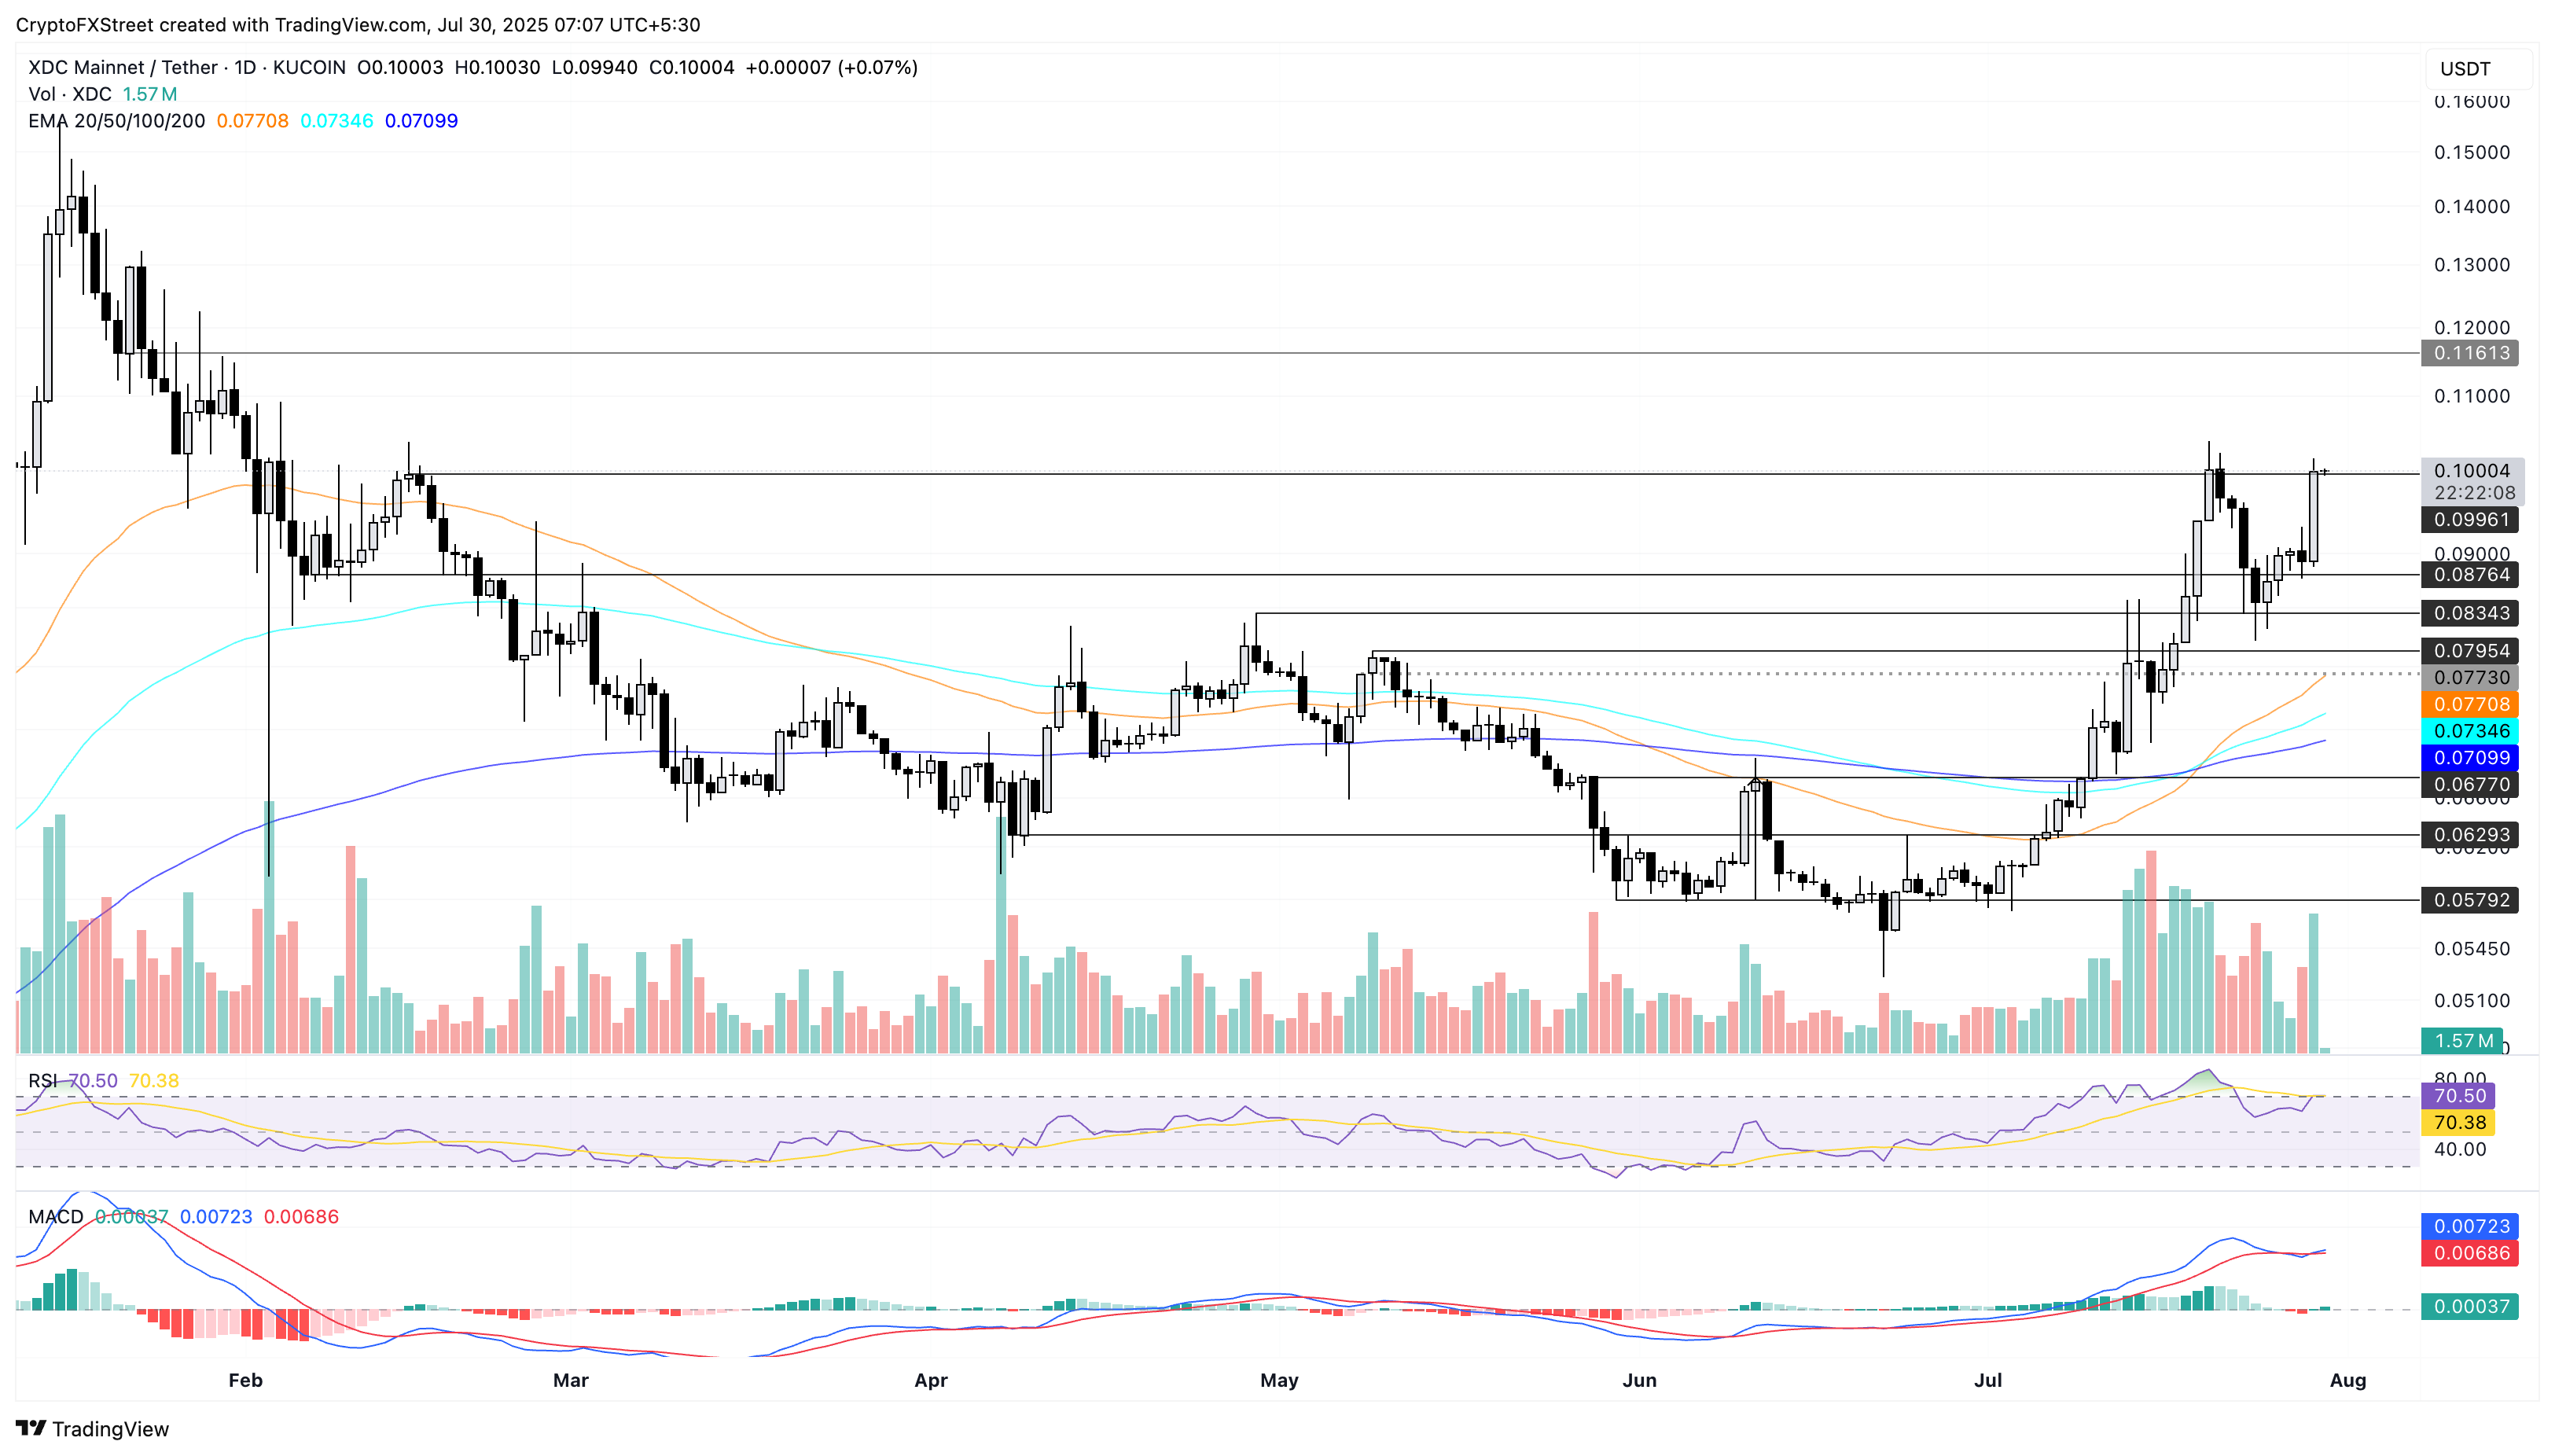
XDC/USDT daily price chart.
On the contrary, a failure to uphold a bullish closing above $0.100 level could result in a reversal to the $0.087 level, marked by the February 6 close.
FORM at record high targets wedge breakout rally
Four maintains the 11% gains from Tuesday at the time of writing, within a rising wedge pattern formed by the two converging trendlines. The resistance trendline is formed by connecting March 19 and July 11 peaks, while the ascending support trendline connects the June 22 and July 29 lows.
A decisive close above the overhead trendline near the $4.00 psychological level could extend the breakout rally to the $4.19 level, coinciding with the R3 pivot level.
The RSI at 69 hovers close to the overbought zone, indicating steady buying pressure. The MACD crosses above its signal line, flashing a buy signal for sidelined investors.
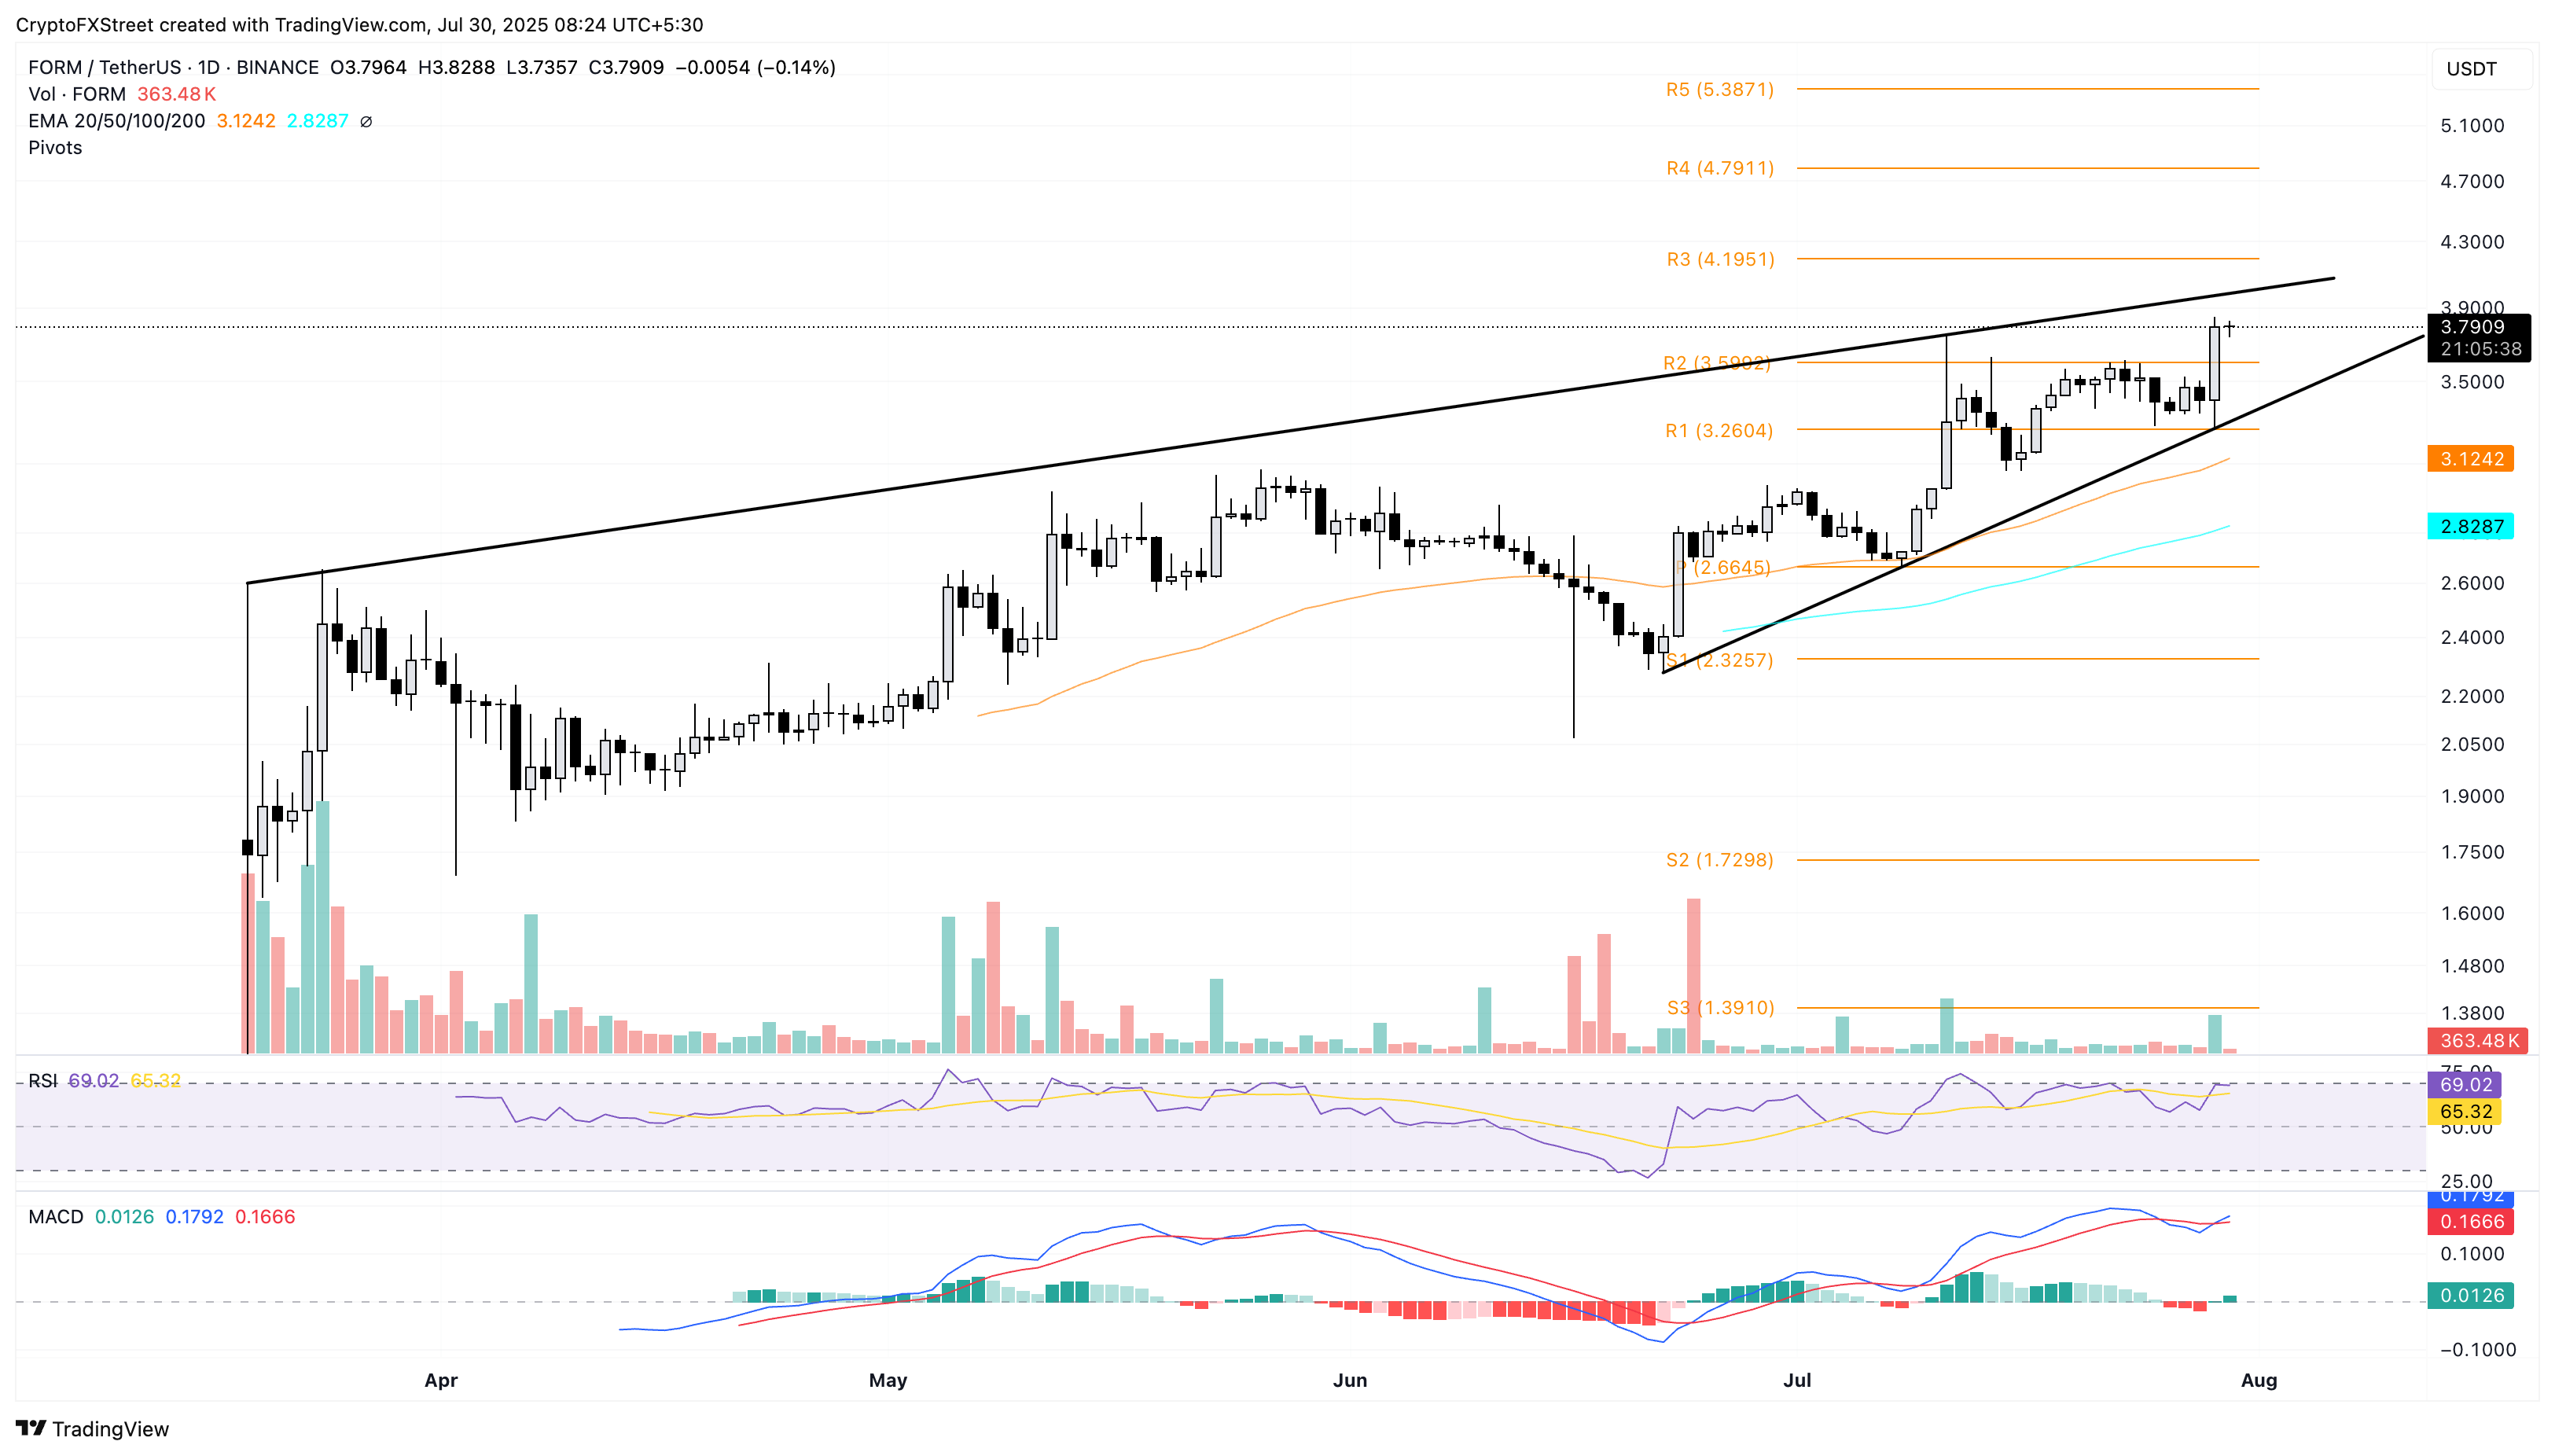
FORM/USDT daily price chart.
On the flip side, a reversal in FORM within the wedge pattern could retest the R2 pivot level at $3.59.
Author

Vishal Dixit
FXStreet
Vishal Dixit holds a B.Sc. in Chemistry from Wilson College but found his true calling in the world of crypto.


