Polkadot ready to bounce to $35 as DOT completes corrective period
- Polkadot price is nearing the end of a powerful Gann time cycle.
- Bullish reversal could see explosive movement higher.
- Downside risks remain as a particularly bearish pattern develops.

Polkadot price is more than 50% below its all-time high. The downside moves it has experienced are the most bearish since May, but the tables may soon turn in the bull’s favor.
Polkadot price completes Gann ‘death cycle’
Polkadot price is in its sixth consecutive week of creating weekly candlesticks with closes below their open. It is also the seventh weekly candlestick in this corrective move. In Gann Analysis, W.D. Gann wrote that he considered a forty-nine to fifty-two-day move in a single direction a ‘death zone'. Gann wrote that instruments that fulfill the criteria of his ‘death zone’ cycle have an extremely high likelihood of experiencing a countertrend move or broader trend correction.
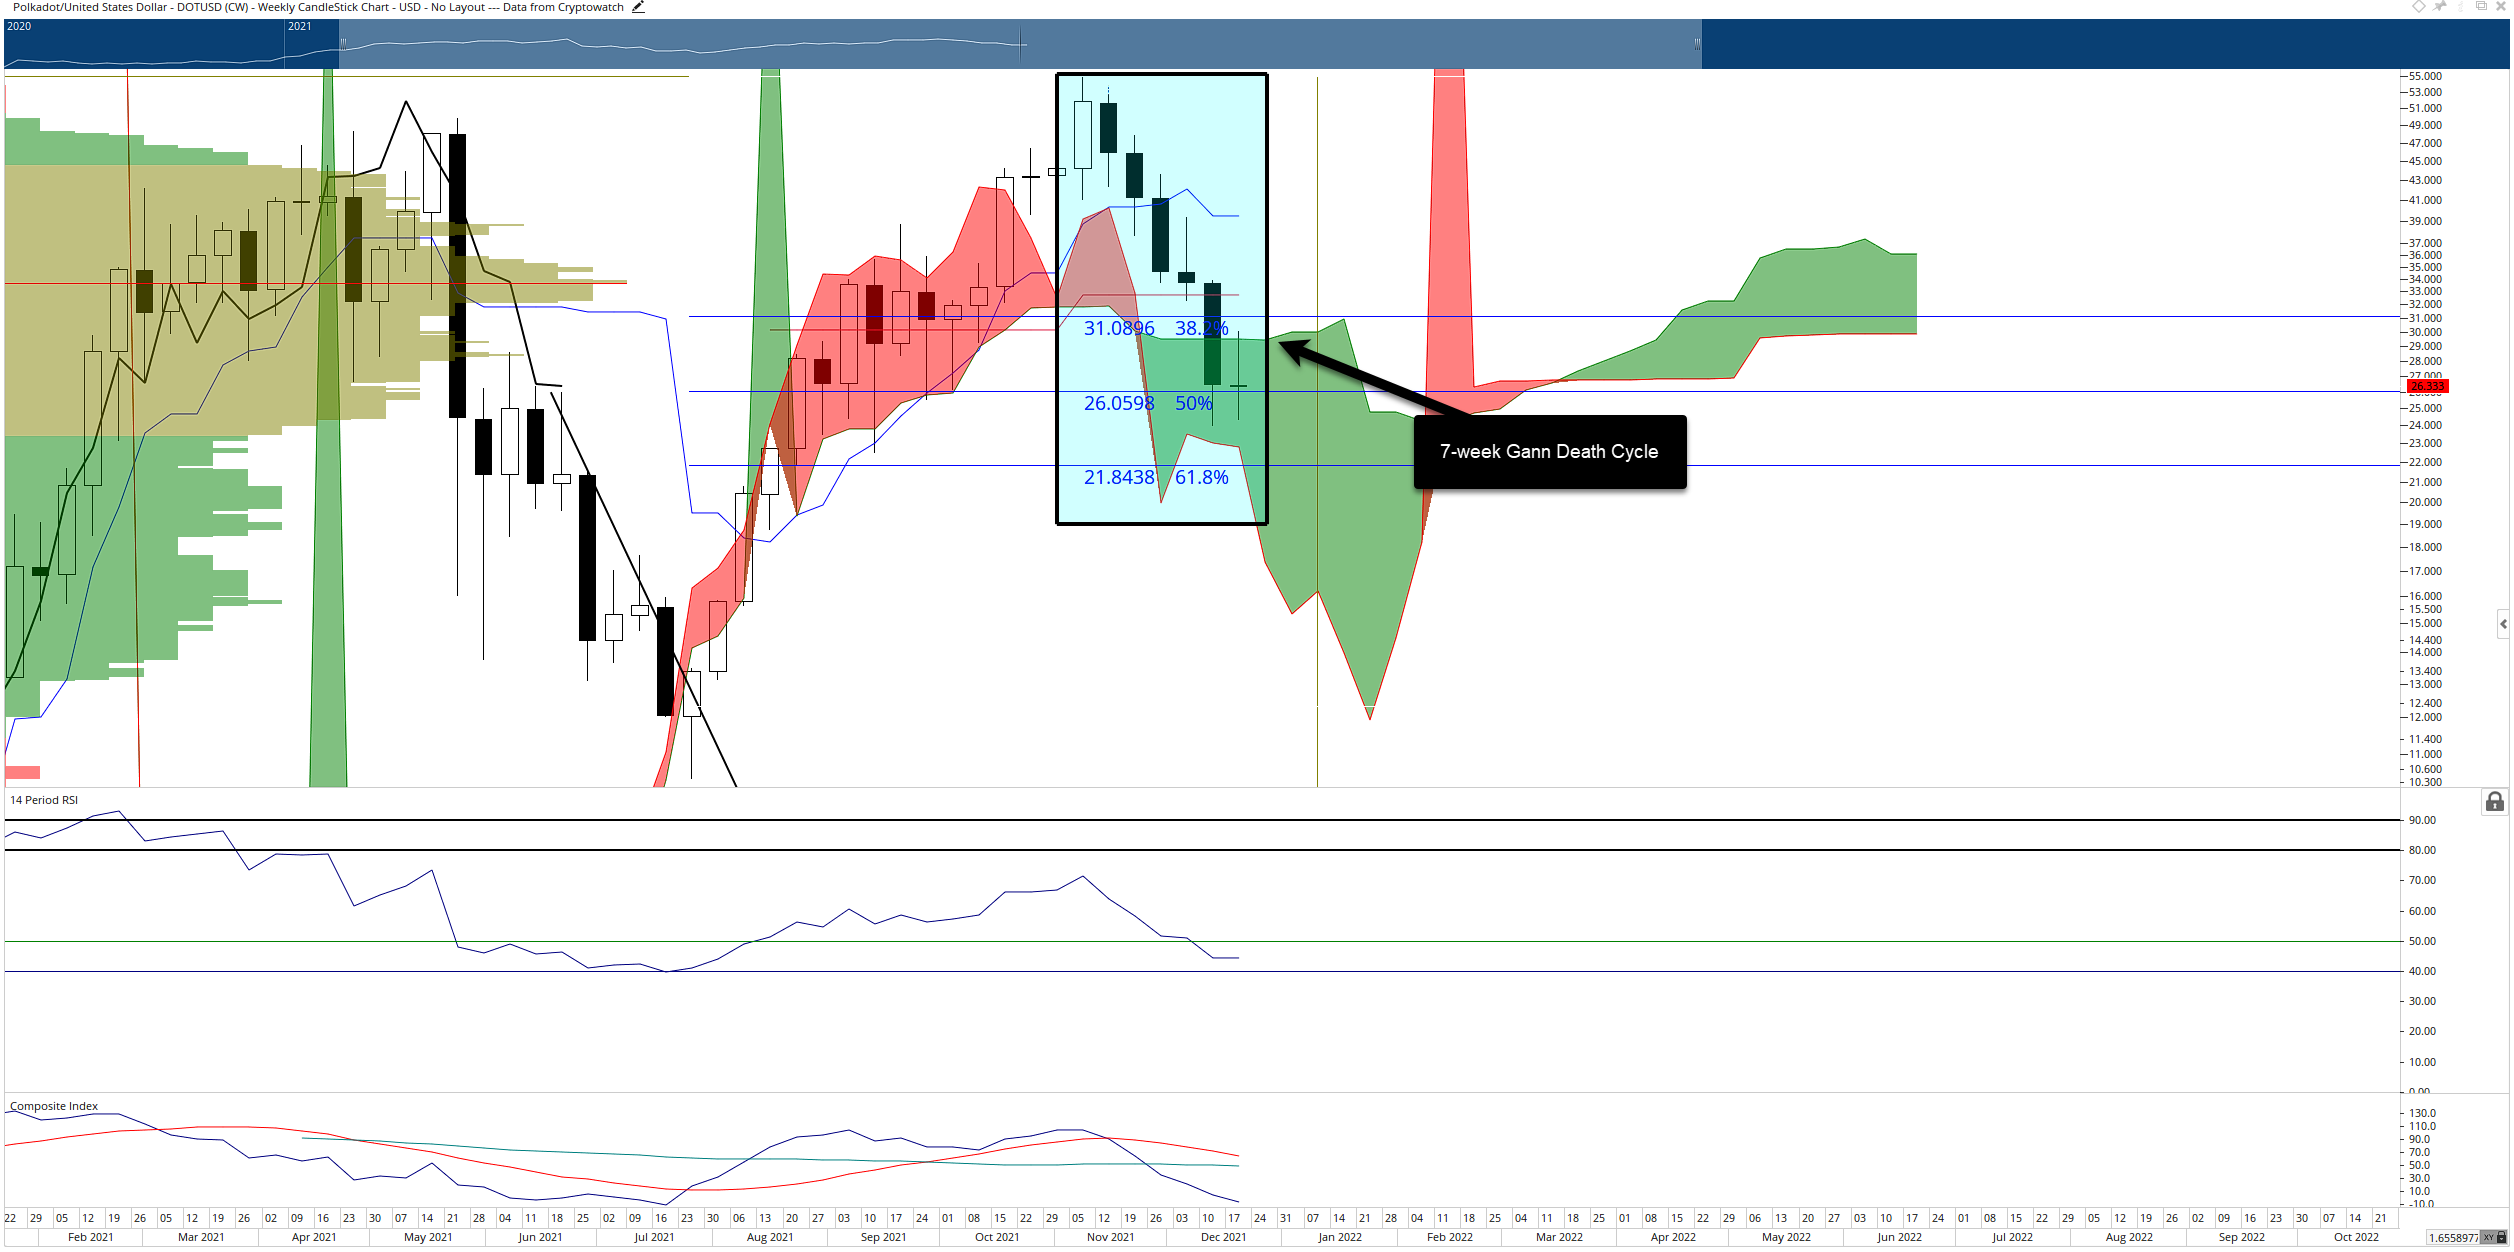
DOT/USDT Weekly Ichimoku Chart
Evidence of an imminent bullish reversal for Polkadot price can be seen on the $0.25/3-box Reversal Point and Figure Chart. A Bullish Shakeout Pattern is currently present. This is one of the single most potent and bullish signals in Point and Figure Analysis. That it appears at the first test of the new uptrend is a highly positive sign.
The theoretical trade setup for Polkadot price is a buy stop at $27.25, a stop loss at $26.25, and a profit target at $35.00. This trade represents a 7.75:1 reward for the risk. This trade is valid if the current O-column does not drop below $25.75. A three-box trailing stop will help protect any implied profits post entry.
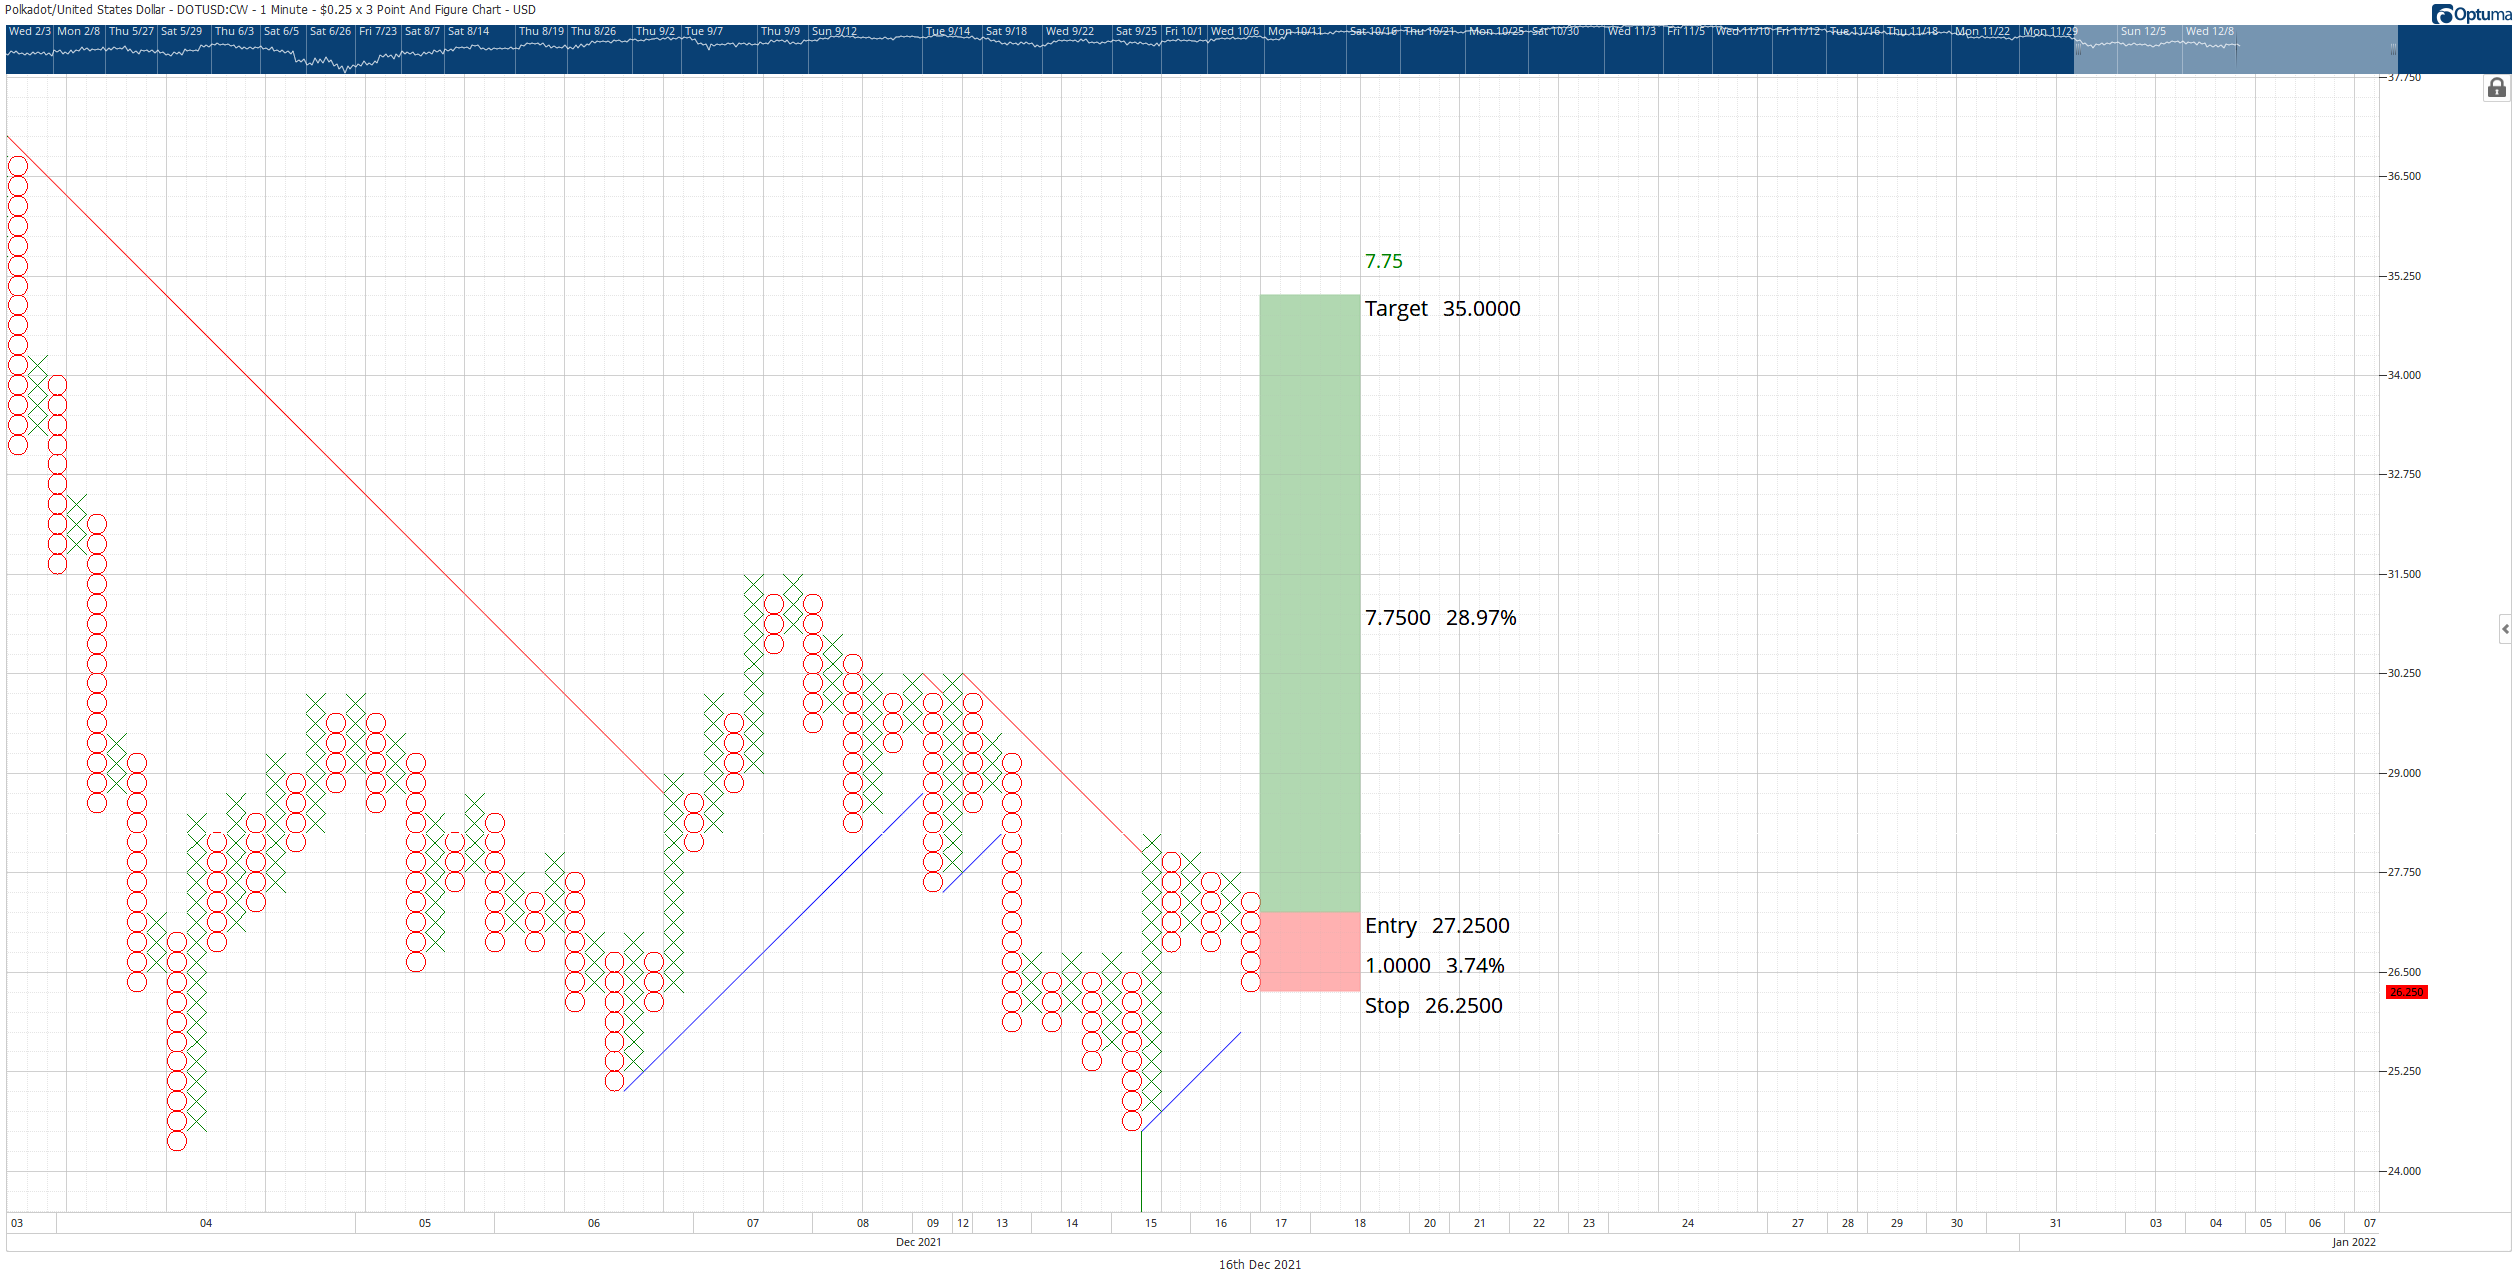
DOT/USDT $0.25/3-box Reversal Point and Figure Chart
However, sell-side pressure and downside risks remain. The $1.00/3-box reversal chart shows a very bearish setup in the form of a quadruple bottom. The hypothetical short trade is a sell stop order at $24.00, a stop loss at $27.00, and a profit target at $14. The short idea is the least likely to play out, and the downside movement may be limited to the $20 value area.
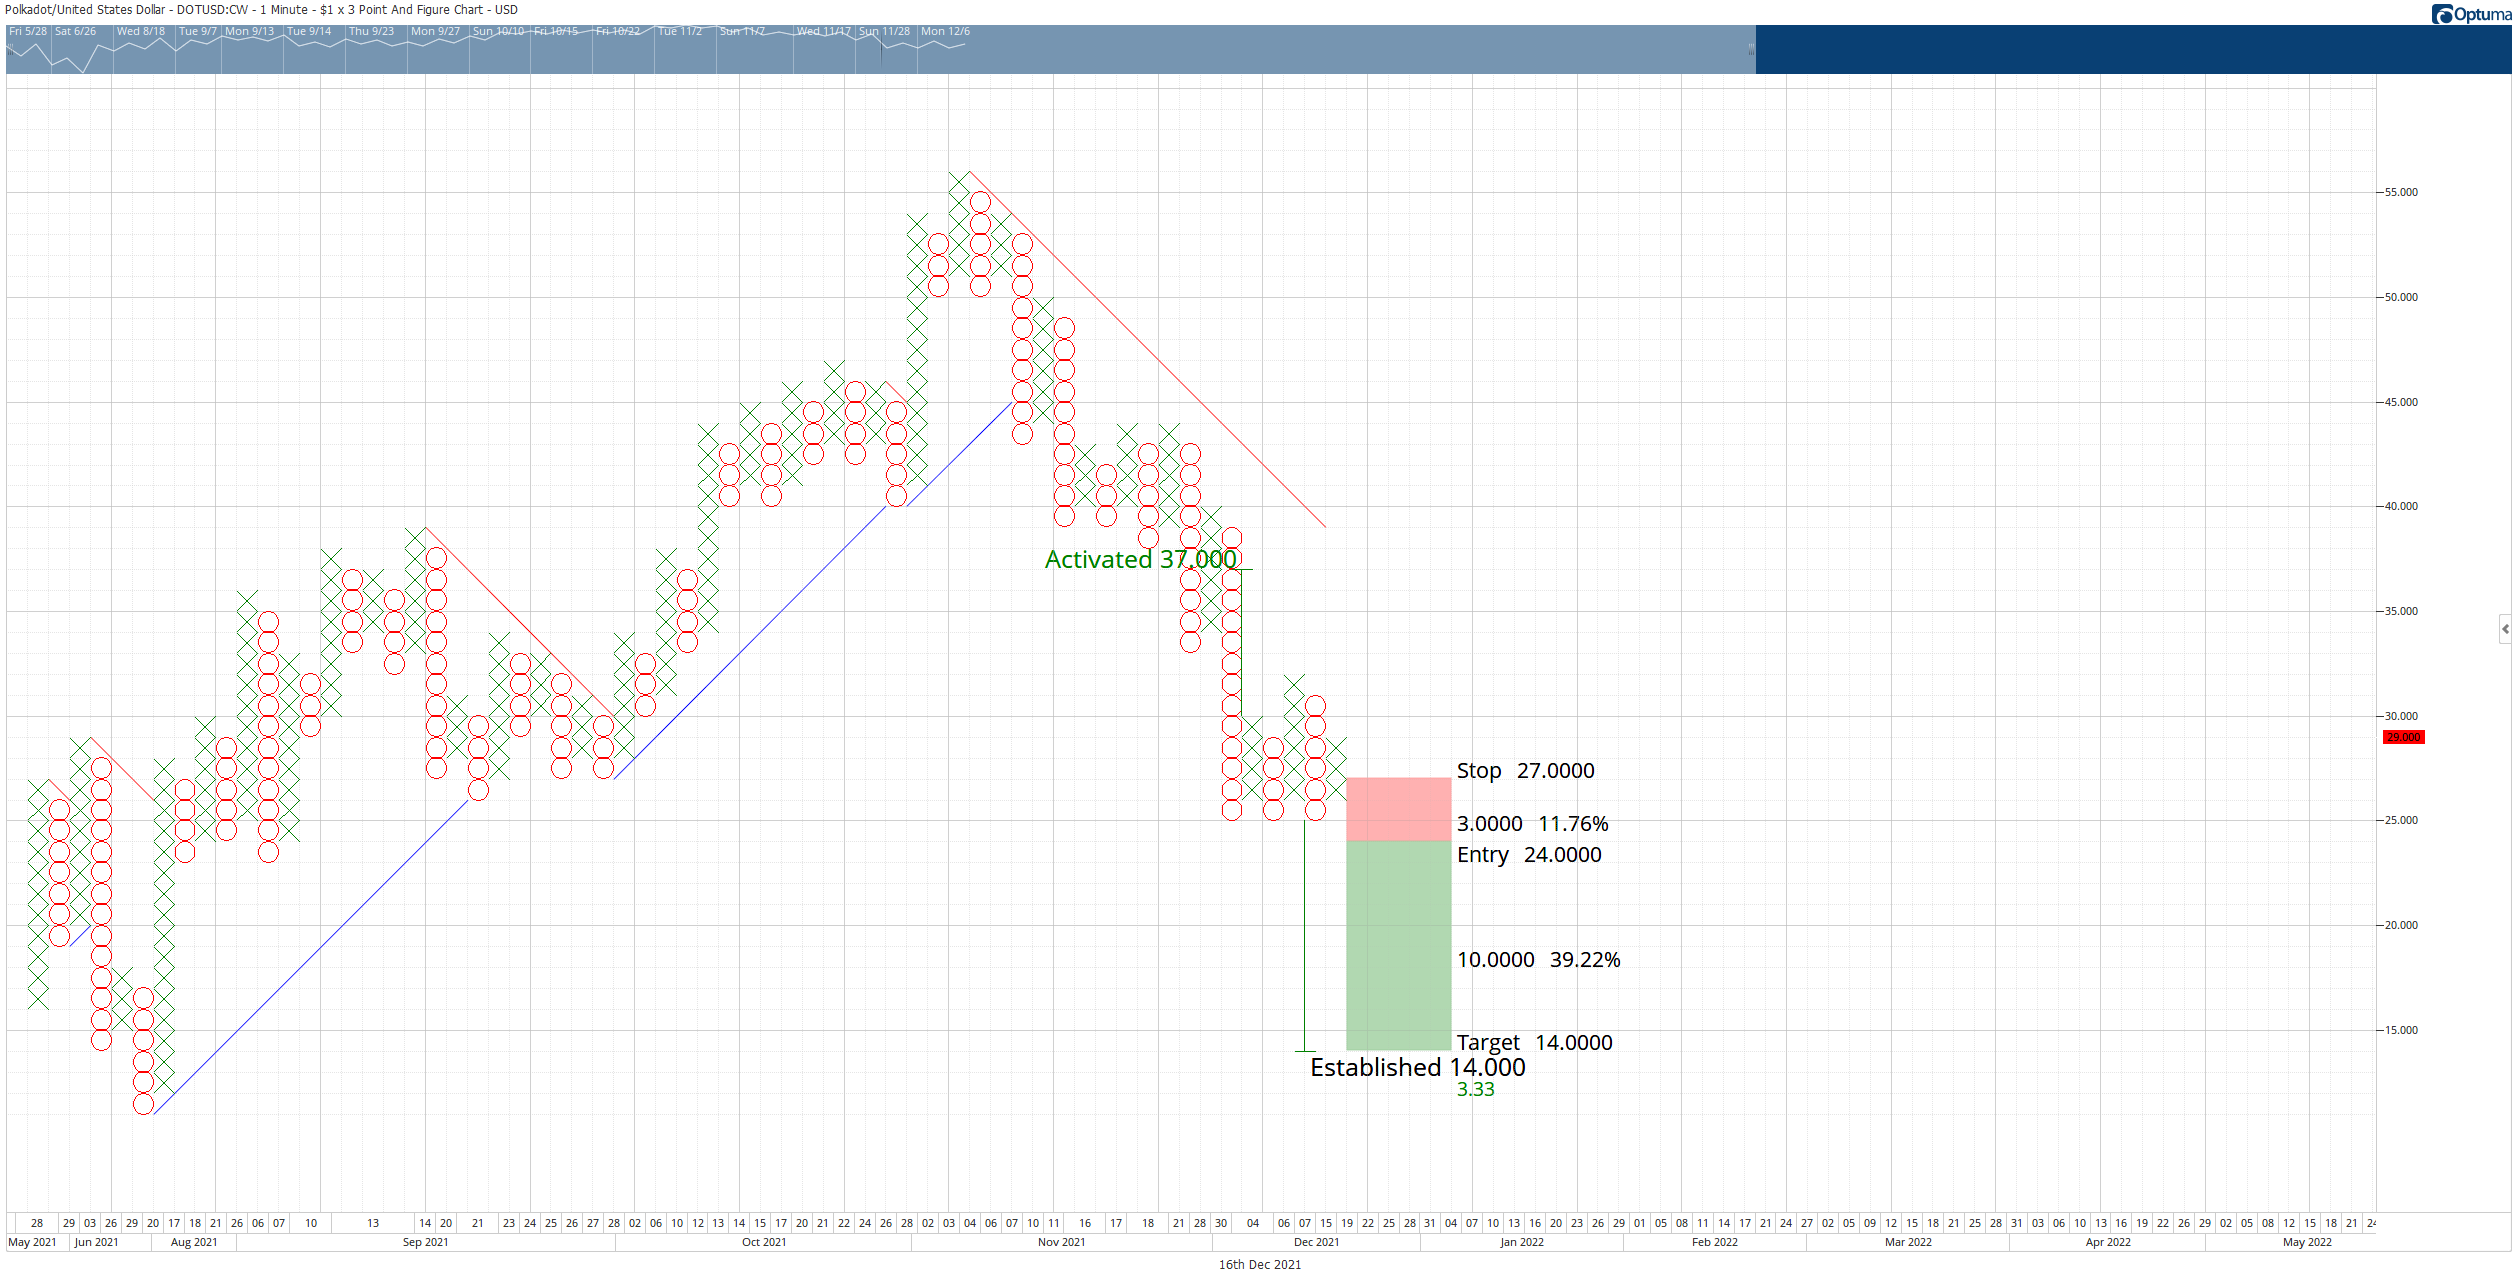
DOT/USDT $1.00/3-box Reversal Point and Figure Chart
Author

Jonathan Morgan
Independent Analyst
Jonathan has been working as an Independent future, forex, and cryptocurrency trader and analyst for 8 years. He also has been writing for the past 5 years.


