Polkadot price stares at a 15% gain as DOT shows signs of life
- Polkadot price has set up a slew of higher highs and higher lows, suggesting a bullish outlook.
- Investors can expect DOT to rally 15% and retest the weekly supply zone, extending from $22.37 to $28.47.
- A breakdown of the $16.89 support level will invalidate the optimistic thesis.

Polkadot price is on a leg-up that could extend higher and retest a resistance barrier confluence. Investors have the opportunity to position themselves in the right direction and capitalize on this short-term up move.
Polkadot price to embark on a small journey
Polkadot price has set up three higher lows and three higher highs since January 24, signaling that an uptrend is underway. The recent swing low is a critical signal that could trigger Polkadot price to climb and retest the $22 hurdle.
Interestingly the weekly supply zone, ranging from $22.37 to $28.47, coincides with this hurdle, increasing its resistance potential and making it a tough nut to crack. Investors can, therefore, expect the DOT rally to cease around this ceiling.
Bullish market participants can still open a long position from the current position at $19.15 and book profits around $22. Or in the case where buying pressure continues, the Polkadot price might pierce the supply zone and retest the weekly barrier at $24.18, coinciding with the 50-day Simple Moving Average (SMA), and bringing the total gain to 26%.
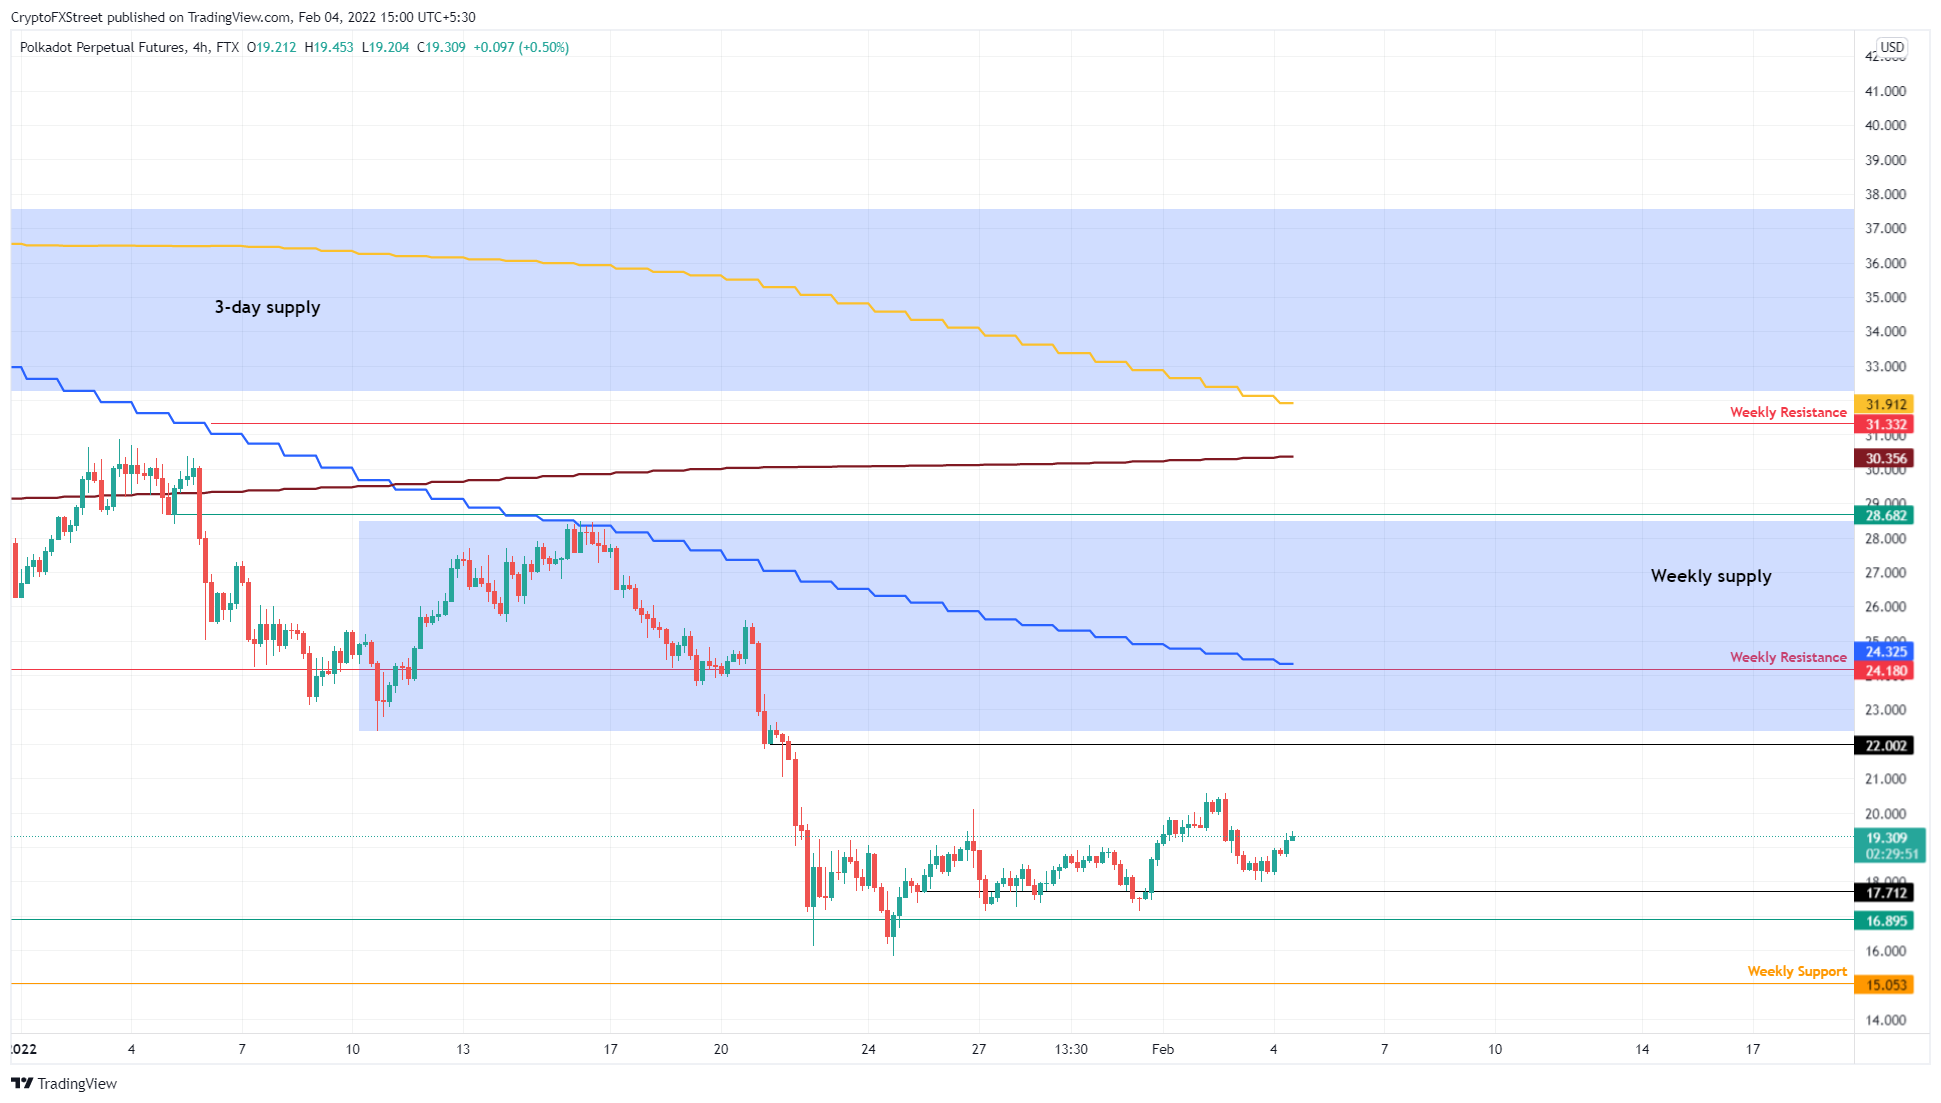
DOT/USDT 4-hour chart
Alternatively, if the Polkadot price produces a four-hour candlestick close below the $16.89 support level, it will create a lower low, and this development will invalidate the bullish thesis, decreasing confidence among sidelined buyers.
In such a situation, sellers may easily take control and knock the Polkadot price down to tag the weekly support level at $15.05. Here, buyers can band together, however, and give the uptrend another go.
Author

Akash Girimath
FXStreet
Akash Girimath is a Mechanical Engineer interested in the chaos of the financial markets. Trying to make sense of this convoluted yet fascinating space, he switched his engineering job to become a crypto reporter and analyst.


