Polkadot Price Prediction: Is this the entry position traders have been waiting for?
- Polkadot price forms a potential double-bottom pattern after another 10% crash on Monday.
- A buy signal presented on the four-hour chart indicates a possible bullish trend reversal.
- DOT price must keep the buyer congestion zone at $6.00 intact to validate an incoming upside move.

Polkadot price is at the tail end of a lengthy seven-day drop. The sell-off worsened over the weekend amidst a sell-the-news initiative in the wake of the Ethereum Merge on Thursday. Although the largest smart contracts token had a successful migration to a proof-of-stake algorithm, the cryptocurrency market turned bloody. The parachains’ token is dancing at $6.30 during the American session on Monday – slightly on top of robust support roughly at $6.00.
Polkadot price prints a crucial double-bottom pattern
Recovery is in its initial stages, as reflected by a bullish candlestick on the eight-hour chart. Odds will likely continue favoring bulls if Polkadot price confirms a double-bottom pattern – shown below.
It is worth mentioning that this chart pattern is a trend reversal formation – allowing traders to take strategic long positions. The pattern occurs after an extended downtrend, as long as the two valleys (bottoms) form at a relatively equal price point (solid support area).
An uptrend builds as soon as the bottom area support is defended. Nevertheless, the double-bottom pattern will only be validated when DOT price breaks above the neckline ($9.71). In other words, traders must wait for the pattern’s confirmation before entering their long positions. An established break above the neckline could propel DOT price by 37.00% to highs marginally above $10.00.
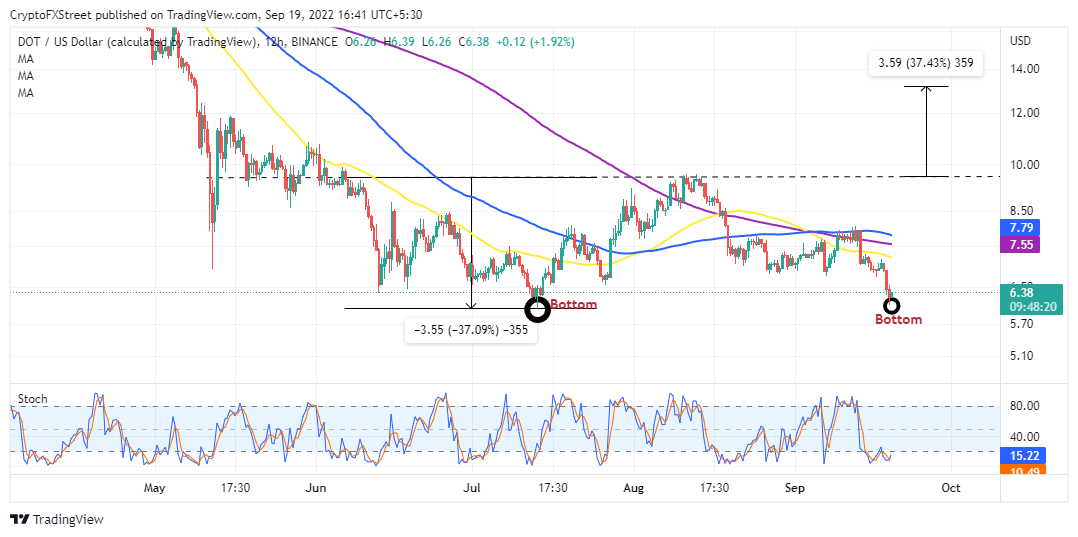
DOT/USD eight-hour chart
The path with the least resistance is on the upside based on the Stochastic oscillator applied to the same chart. As the index lifts from the oversold region (20.00 and below), Polkadot price is bound to regain positive momentum. Affirming this bullish trend reversal is the divergence created by the Stochastic above its moving average.
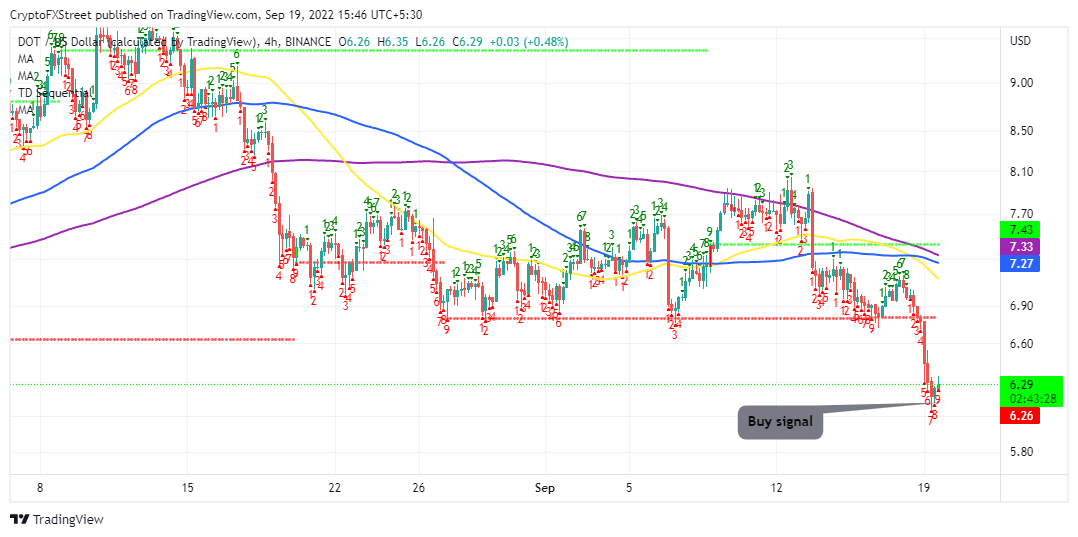
DOT/USD four-hour chart
Similarly, the TD Sequential indicator recently added credence to the Polkadot price bullish outlook by flaunting a buy signal. The call to buy DOT manifested in a red nine candlestick, implying that the downtrend was in its final stages.
It also signals buyers are ready to resume control for a significantly bullish outcome. A buy order is usually recommended when the low of the sixth and seventh bars is exceeded by that of the eighth and ninth candles.
Author

John Isige
FXStreet
John Isige is a seasoned cryptocurrency journalist and markets analyst committed to delivering high-quality, actionable insights tailored to traders, investors, and crypto enthusiasts. He enjoys deep dives into emerging Web3 tren


