Polkadot Price Prediction: DOT is on the verge of a massive price move
- DOT is currently trading at $3.94 after a steep 43% correction from its all-time high.
- Polkadot was able to reach $5 billion in market capitalization within weeks of getting listed on exchanges.

Polkadot has been one of the most successful cryptocurrency projects, quickly climbing the market capitalization ranks positioning itself at number 7.
Polkadot is facing significant selling pressure
One of the most important patterns formed against DOT bulls is the descending triangle pattern on the daily chart.
DOT/USDT daily chart
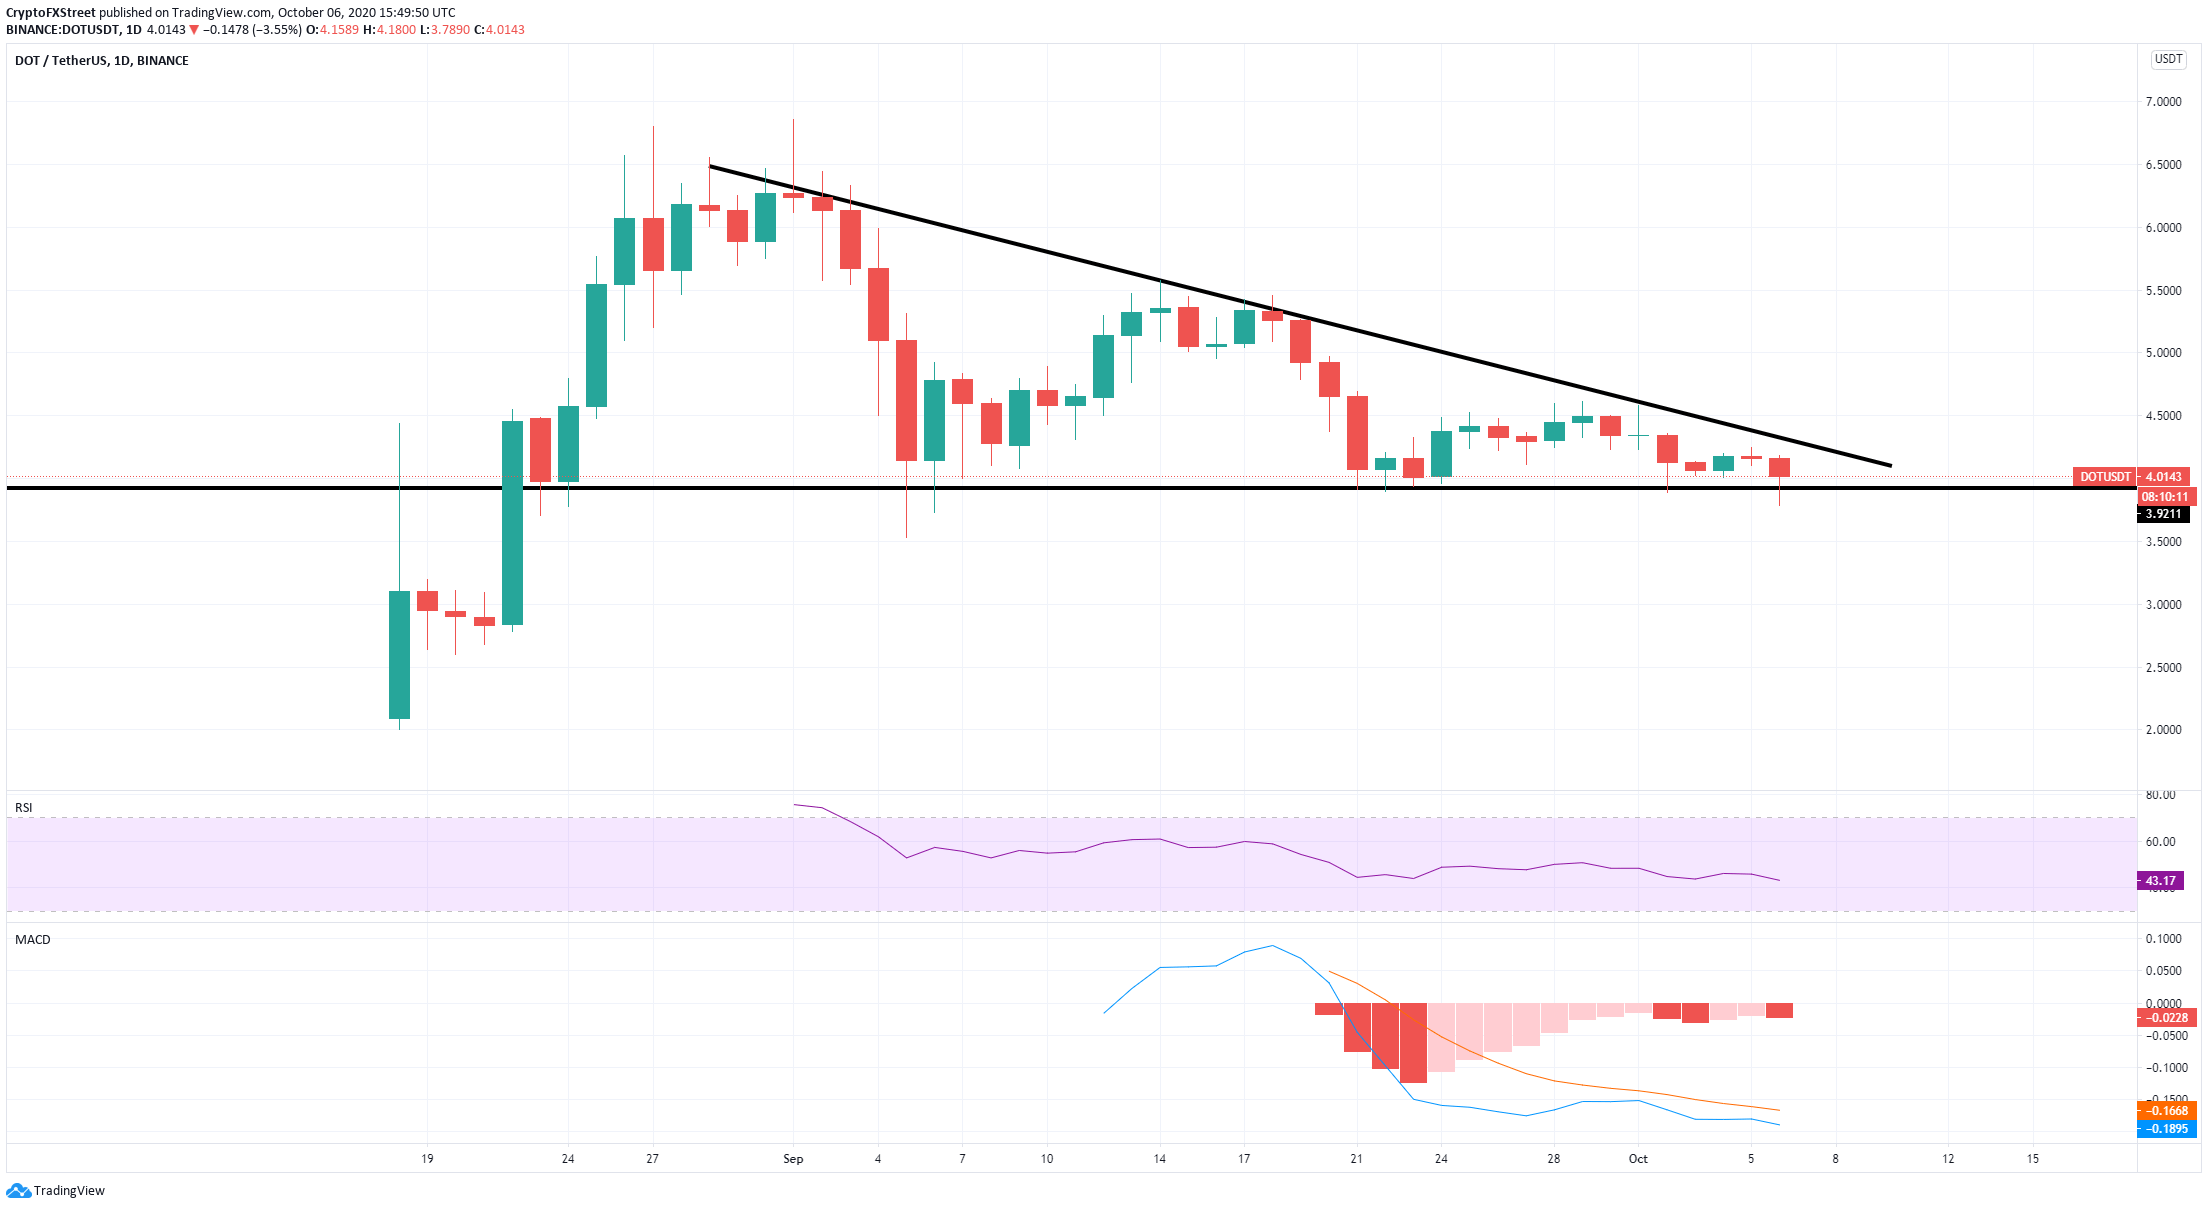
His bearish pattern has a horizontal trendline that connects a series of lows, representing the most significant support level. The current price of DOT is just above the support trendline at $3.9. A bearish breakout would be devastating for the digital asset's price and could lead to a 50% decline.
$DOT
— TraderXO (@Trader_XO) October 6, 2020
Ball height vs. time for first few bounces (assuming no aerodynamic drag). pic.twitter.com/h96XdhYVP7
Full-time trader, ‘Trader_XO’ tweeted a chart showing the magnitude of DOT's bounces from the support level at $3.9. We can observe that the first bounce was the strongest, followed by subsequent bounces that are far weaker, about half or even lower than the previous ones. The last bounce happened a few days ago and seemed to indicate that the next try could be a bearish breakout.
DOT/USD 4-hour chart
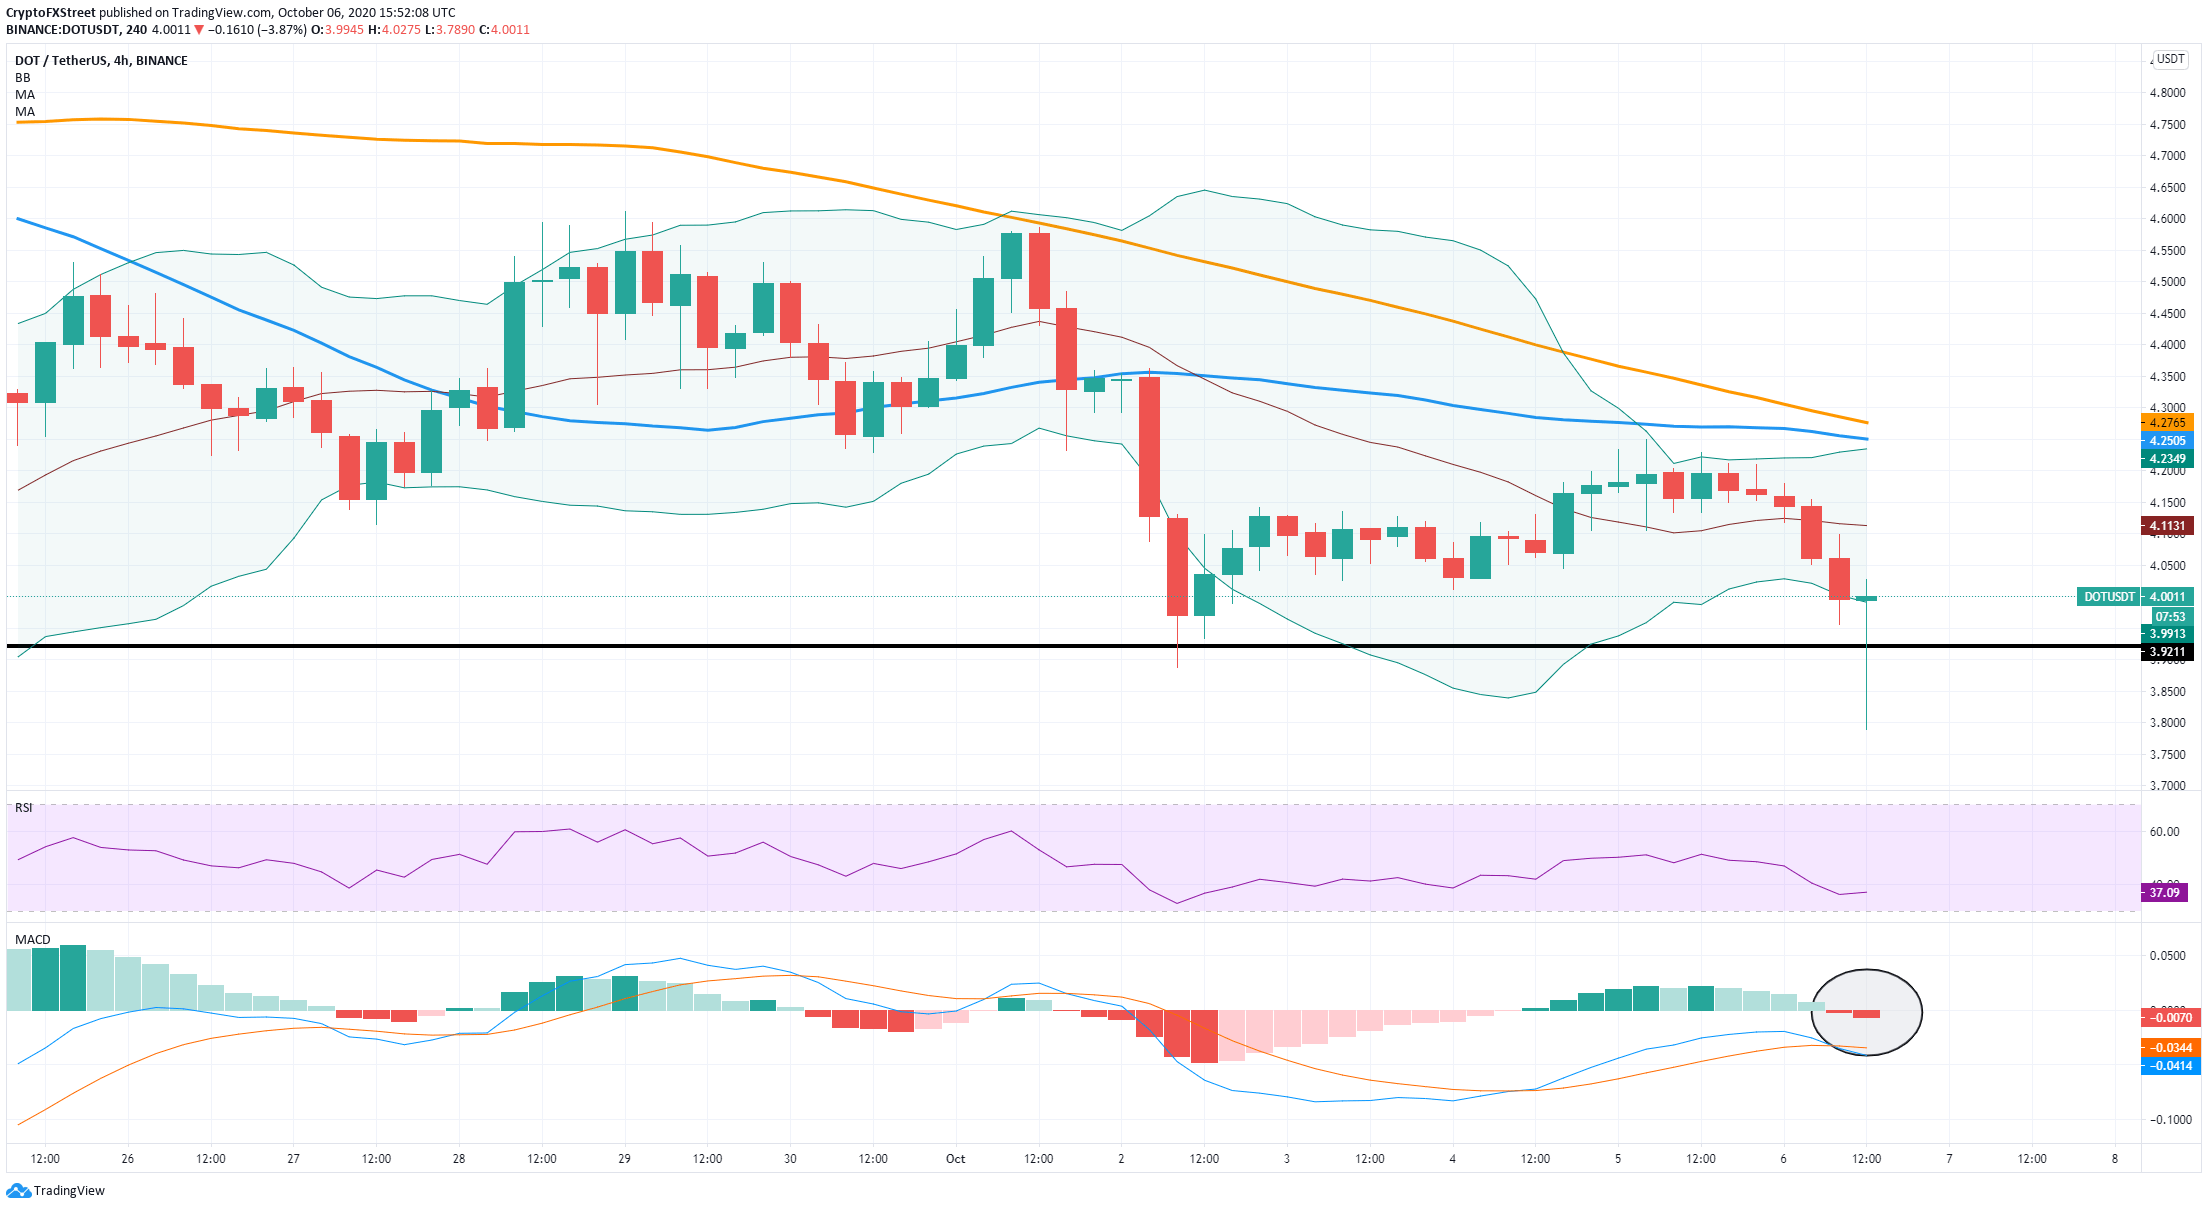
The price of DOT has already pierced the support level at $3.9 but managed to recover. The MACD turned bearish, which usually indicates continuation moves to the downside. Additionally, the Bollinger bands are squeezing a lot, meaning that a major price move is underway.
On the other hand, the last candlestick formed on the 4-hour chart has the potential to close as a bullish hammer candlestick. This candle indicates that buyers are interested in buying DOT at $3.9 and below, defending the support level and the lower Bollinger band.
If DOT gets bullish continuation after the close of the candlestick, the next price target can be $4.11, the middle of the BB indicator, and then $4.25 where the 50-SMA and the 100-SMA currently stand.
Key points to look for in the short-term
In essence, bears need to look out for a clear breakout below $3.9, which is the most critical support level. There is very little support below this point, which could lead DOT to a 50% decline towards $2
On the flip side, bulls were able to push DOT above $3.9 after the price touched $3.78, creating a potential bullish hammer candlestick on the 4-hour chart. A continuation move can take the digital asset up to $4.25 where the upper BB, the 50-SMA, and the 100-SMA are currently located.
Author

Lorenzo Stroe
Independent Analyst
Lorenzo is an experienced Technical Analyst and Content Writer who has been working in the cryptocurrency industry since 2012. He also has a passion for trading.


