|

Polkadot Price Forecast: DOT needs to hold critical level to avoid slipping

  • Polkadot price is trading right above an important support level on the 4-hour chart.
  • The digital asset has been under consolidation for the past three days.
  • There is not a lot of resistance on the way up for DOT bulls.

Polkadot established an all-time high at $46.8 on April 3 and has experienced a healthy correction since then, down to $40.66. The digital asset is trying to form a local bottom to see a new high in the short term.

Polkadot price must defend the 50 SMA support level

On the 4-hour chart, Polkadot has established a robust support level around $40.7, which also coincides with the 50 SMA. Losing this significant support point will quickly drive Polkadot price down to $39.4, which is the 61.8% Fibonacci level. 

dot price

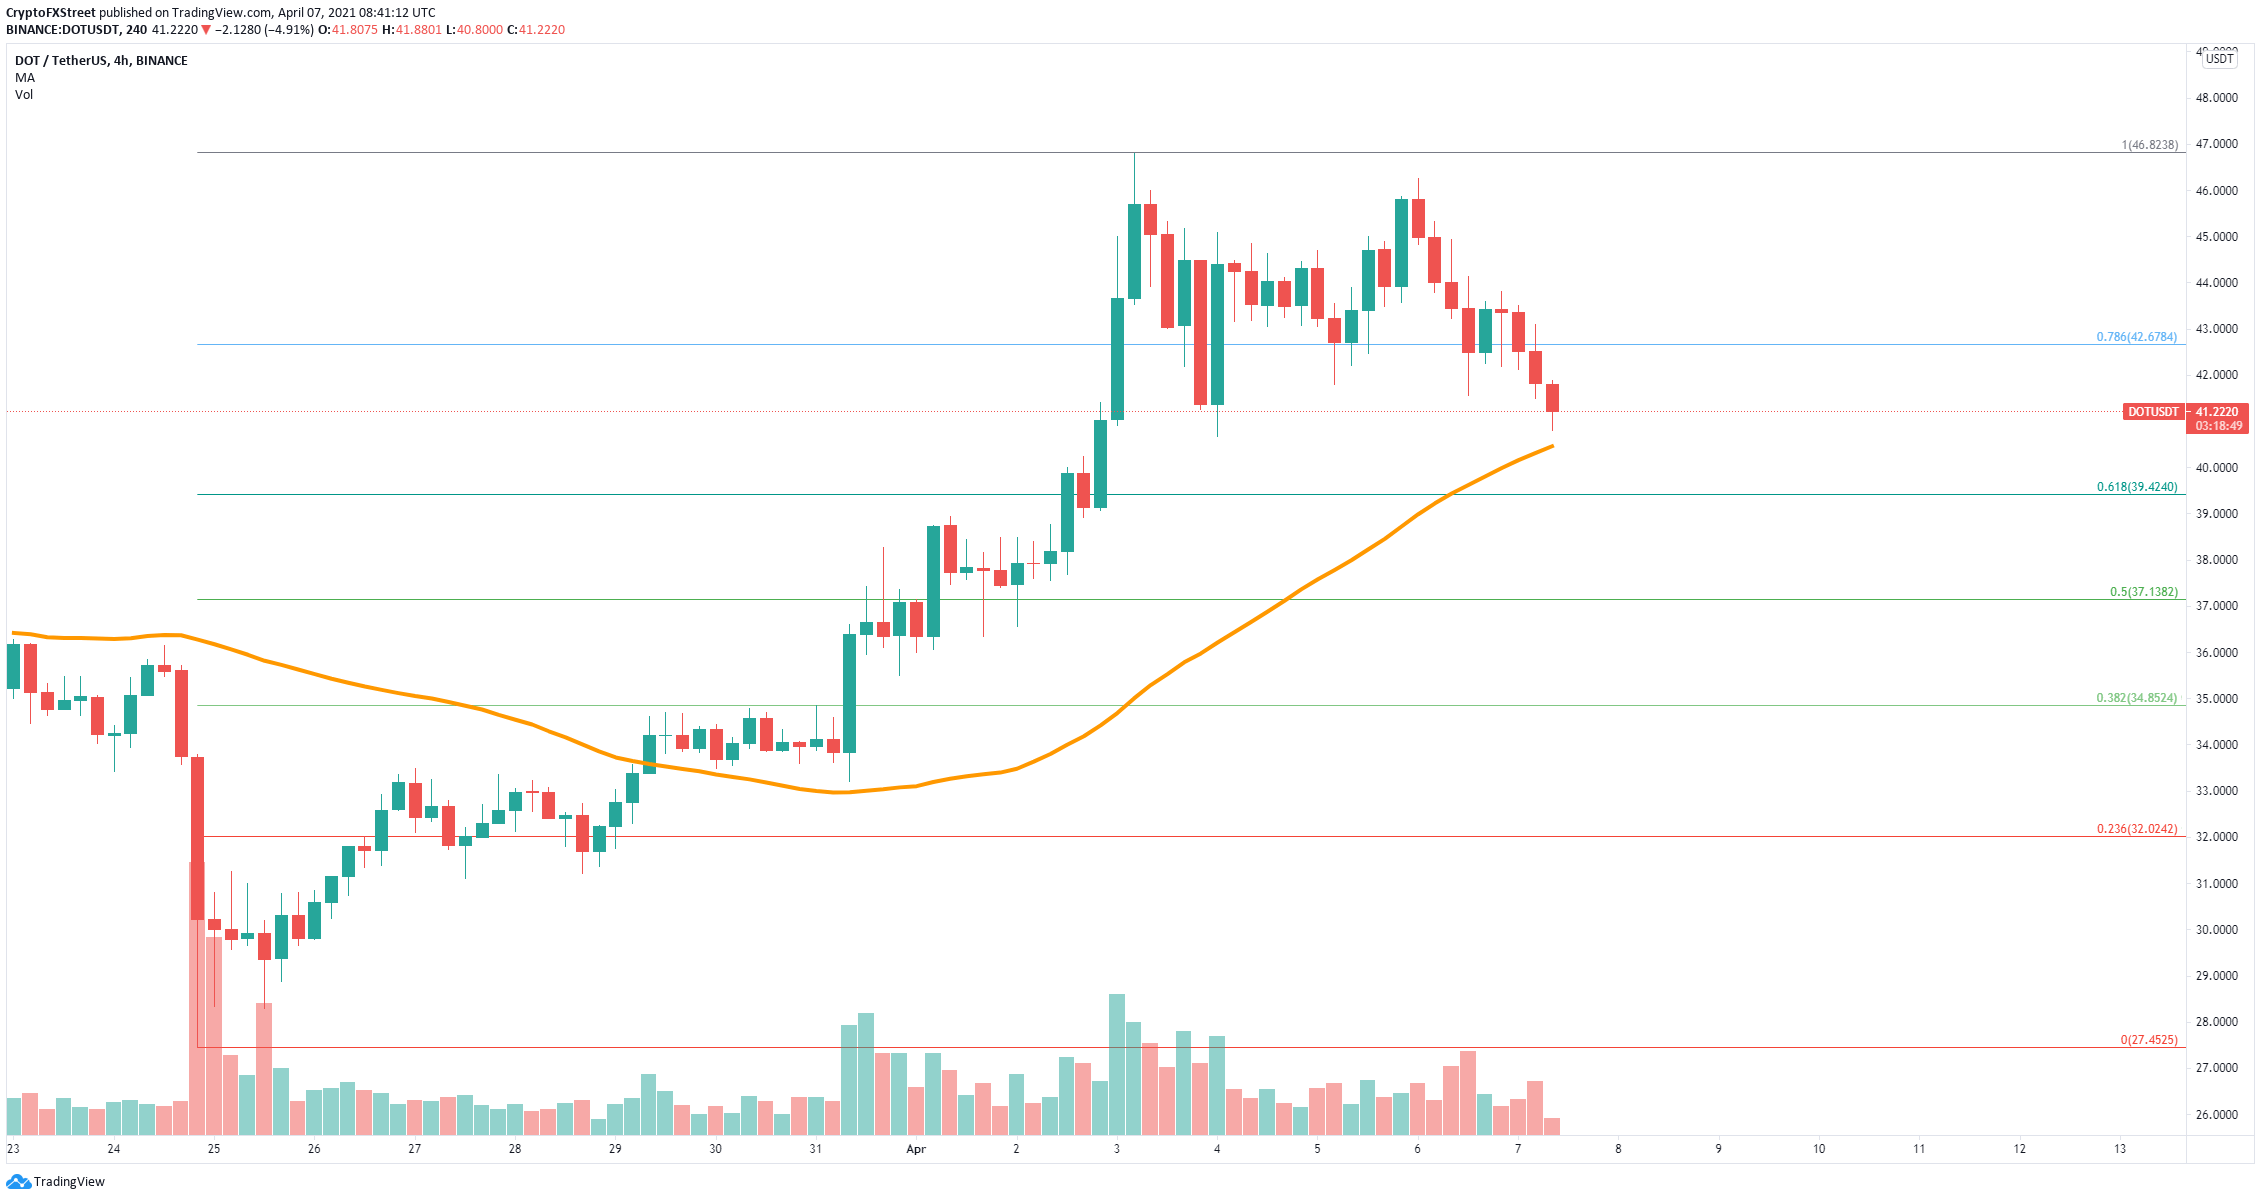
DOT/USD 4-hour chart

If this level is lost, DOT can fall as low as $37.13 at the 50% Fib level as the support below is relatively weak given the magnitude of the rally towards the all-time high. 

On the flip side, defending the support level at $40.7 should push Polkadot price towards $42.7 at the 78.6% Fibonacci level. There is not a lot of resistance towards the all-time high at $46.8, which means bulls can drive DOT towards this level eventually.

Author

Lorenzo Stroe

Lorenzo Stroe

Independent Analyst

Lorenzo is an experienced Technical Analyst and Content Writer who has been working in the cryptocurrency industry since 2012. He also has a passion for trading.

More from Lorenzo Stroe
Share:

Editor's Picks

Ripple extends losses as derivatives interest cools

Ripple (XRP) extends its bearish roll near $1.12 support on Friday, reflecting intense headwinds in the broader crypto market largely attributable to macroeconomic pressure.

Crypto Today: Bitcoin, Ethereum, XRP weaken further as capital outflows persist

Macroeconomic headwinds continue to weigh heavily on the cryptocurrency market on Friday, prompting major assets like Bitcoin (BTC) to pare earlier gains and extend losses after June’s brief relief rally.

Bitcoin Weekly Forecast: Recovery hopes fade after the Fed spoils the party

Bitcoin is set to end the week in the red, trading near the 200-Week Simple Moving Average at around $62,300 on Friday. Institutional selling persists, capping BTC’s recovery as spot Exchange Traded Funds point to a sixth consecutive week of outflows.

Sui risks a deeper bearish leg despite on-chain resilience

Sui is down 2% on Friday, extending its decline toward the recent support leg formed at $0.6618. The Total Value Locked in the Sui ecosystem has stabilized around 600 million SUI tokens, reflecting resilient user demand.

Bitcoin: Recovery hopes fade after the Fed spoils the party
Bitcoin (BTC) is set to end the week in the red, trading near the 200-Week Simple Moving Average (SMA) at around $62,300 on Friday. Institutional selling persists, capping BTC’s recovery as spot Exchange Traded Funds (ETFs) point to a sixth consecutive week of outflows.