|

Polkadot Price Forecast: DOT begins corrective downtrend towards $10

  • Polkadot price is down by 23% since its all-time high at $19.4.
  • The digital asset shows clear signs of a potential correction period down to $10.

Polkadot had a massive run to its all-time high of $19.4 on January 16, reaching a market capitalization of $16 billion and placing itself as the 4th largest digital asset. DOT is still up by 60% in the past week despite the recent sell-off.

Polkadot pullback can extend further according to technicals

On the daily chart, Polkadot price has smashed through the 78.6% Fibonacci level of its latest rally at $16.8 and it’s currently holding the 61.8% level at $14.7. A breakdown below this point can send Polkadot price down to $13.
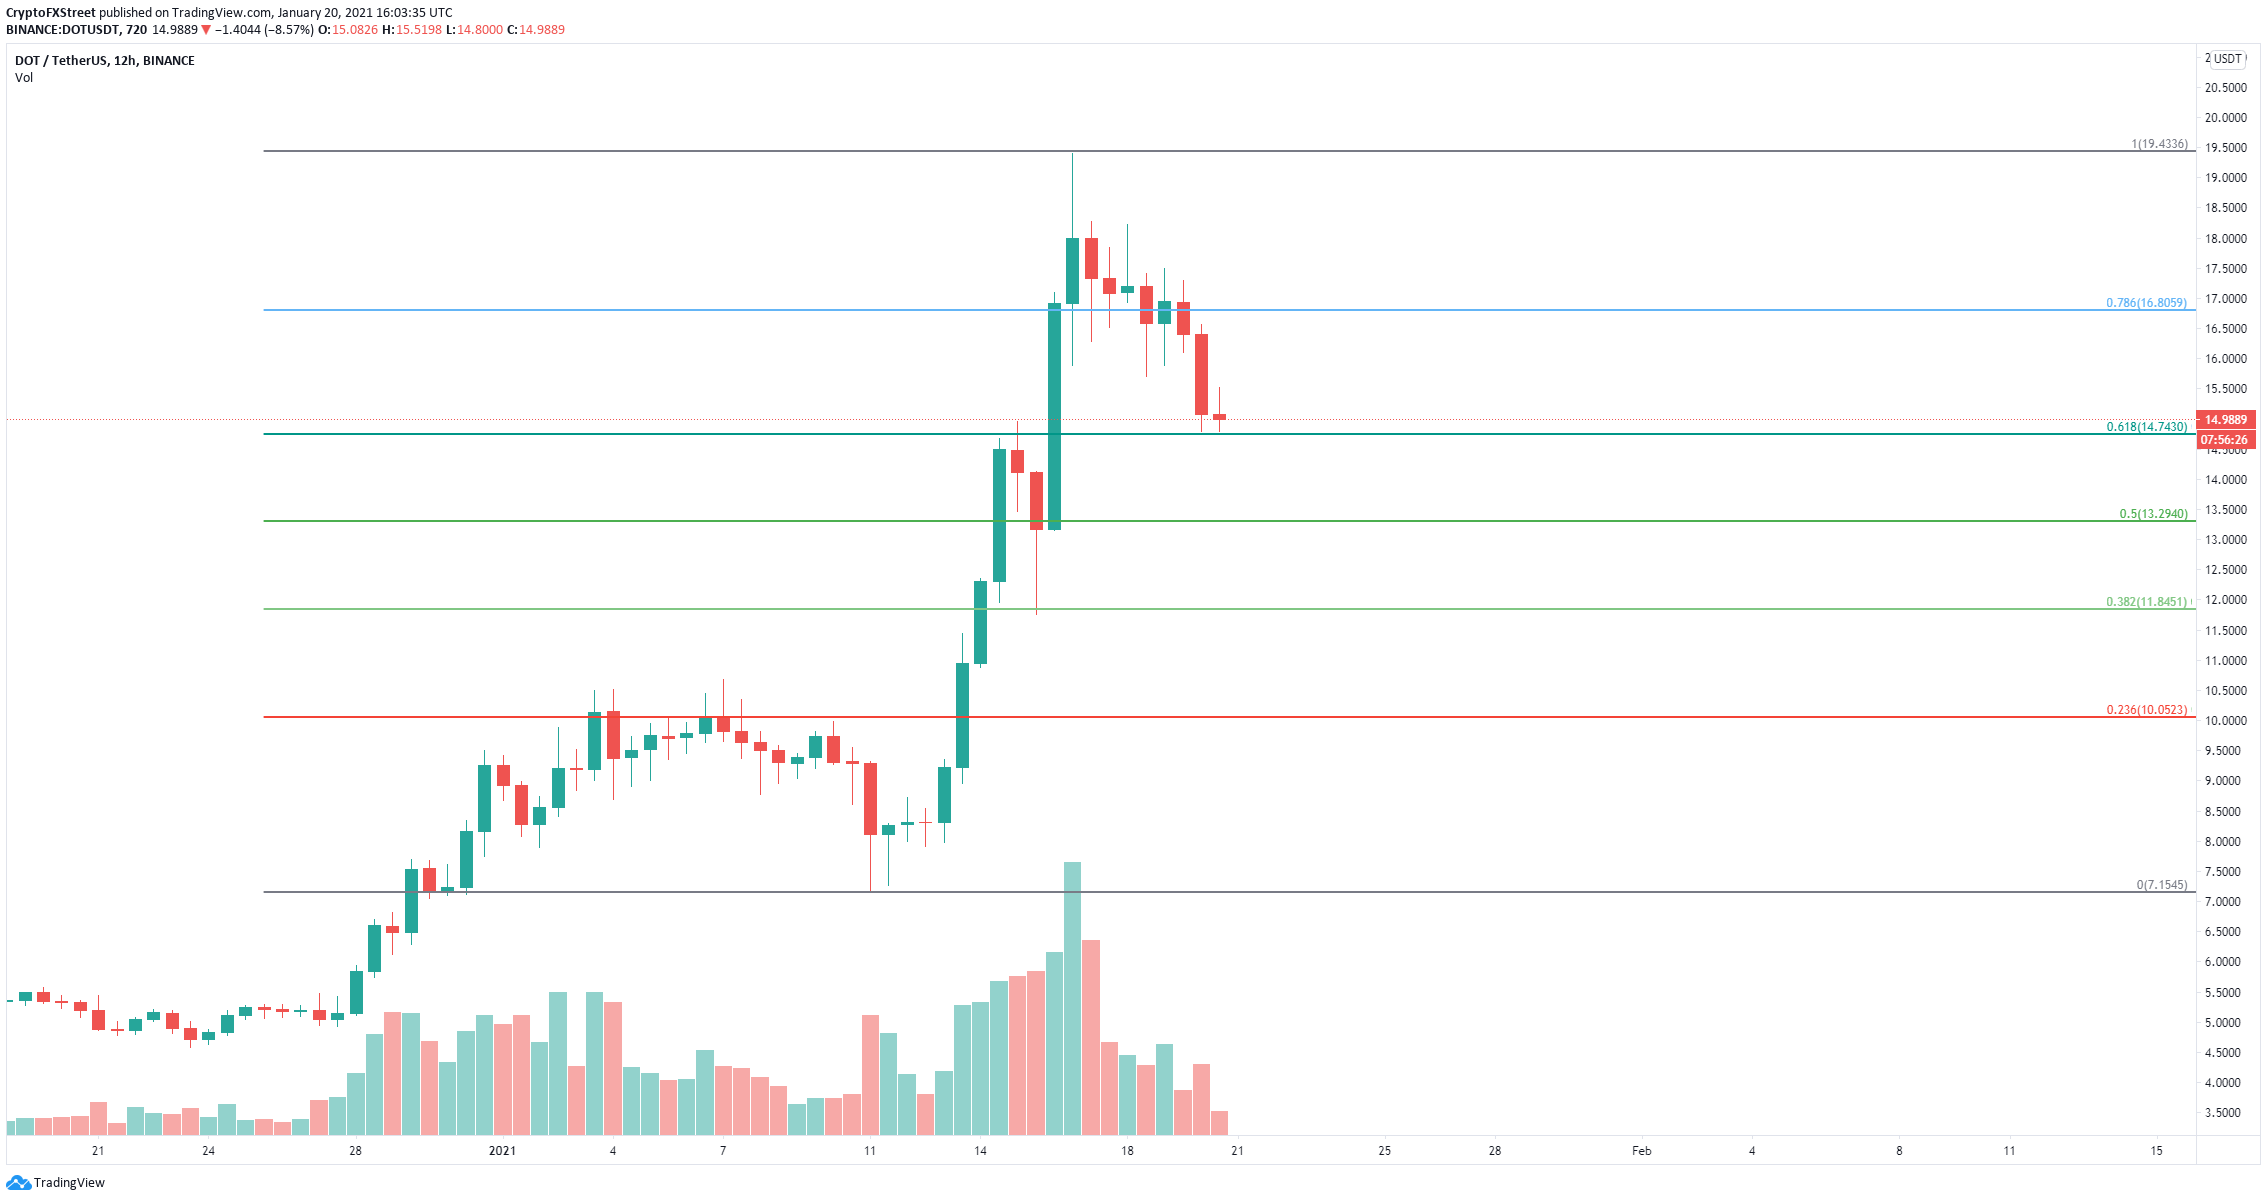
dot price

DOT/USD daily chart

Other price targets for the bears include the 38.2% Fib level at $11.84 and finally the 23.6% level at $10. On January 16, Polkadot saw a massive spike in its social volume, which measures the number of times the digital asset has been mentioned across social media channels.

dot price

DOT Social Volume

A high social volume indicates that an asset could be on the verge of a potential correction and so far, bears have seen a lot of confirmation as Polkadot price is down by 23% since the peak.

 
dot price

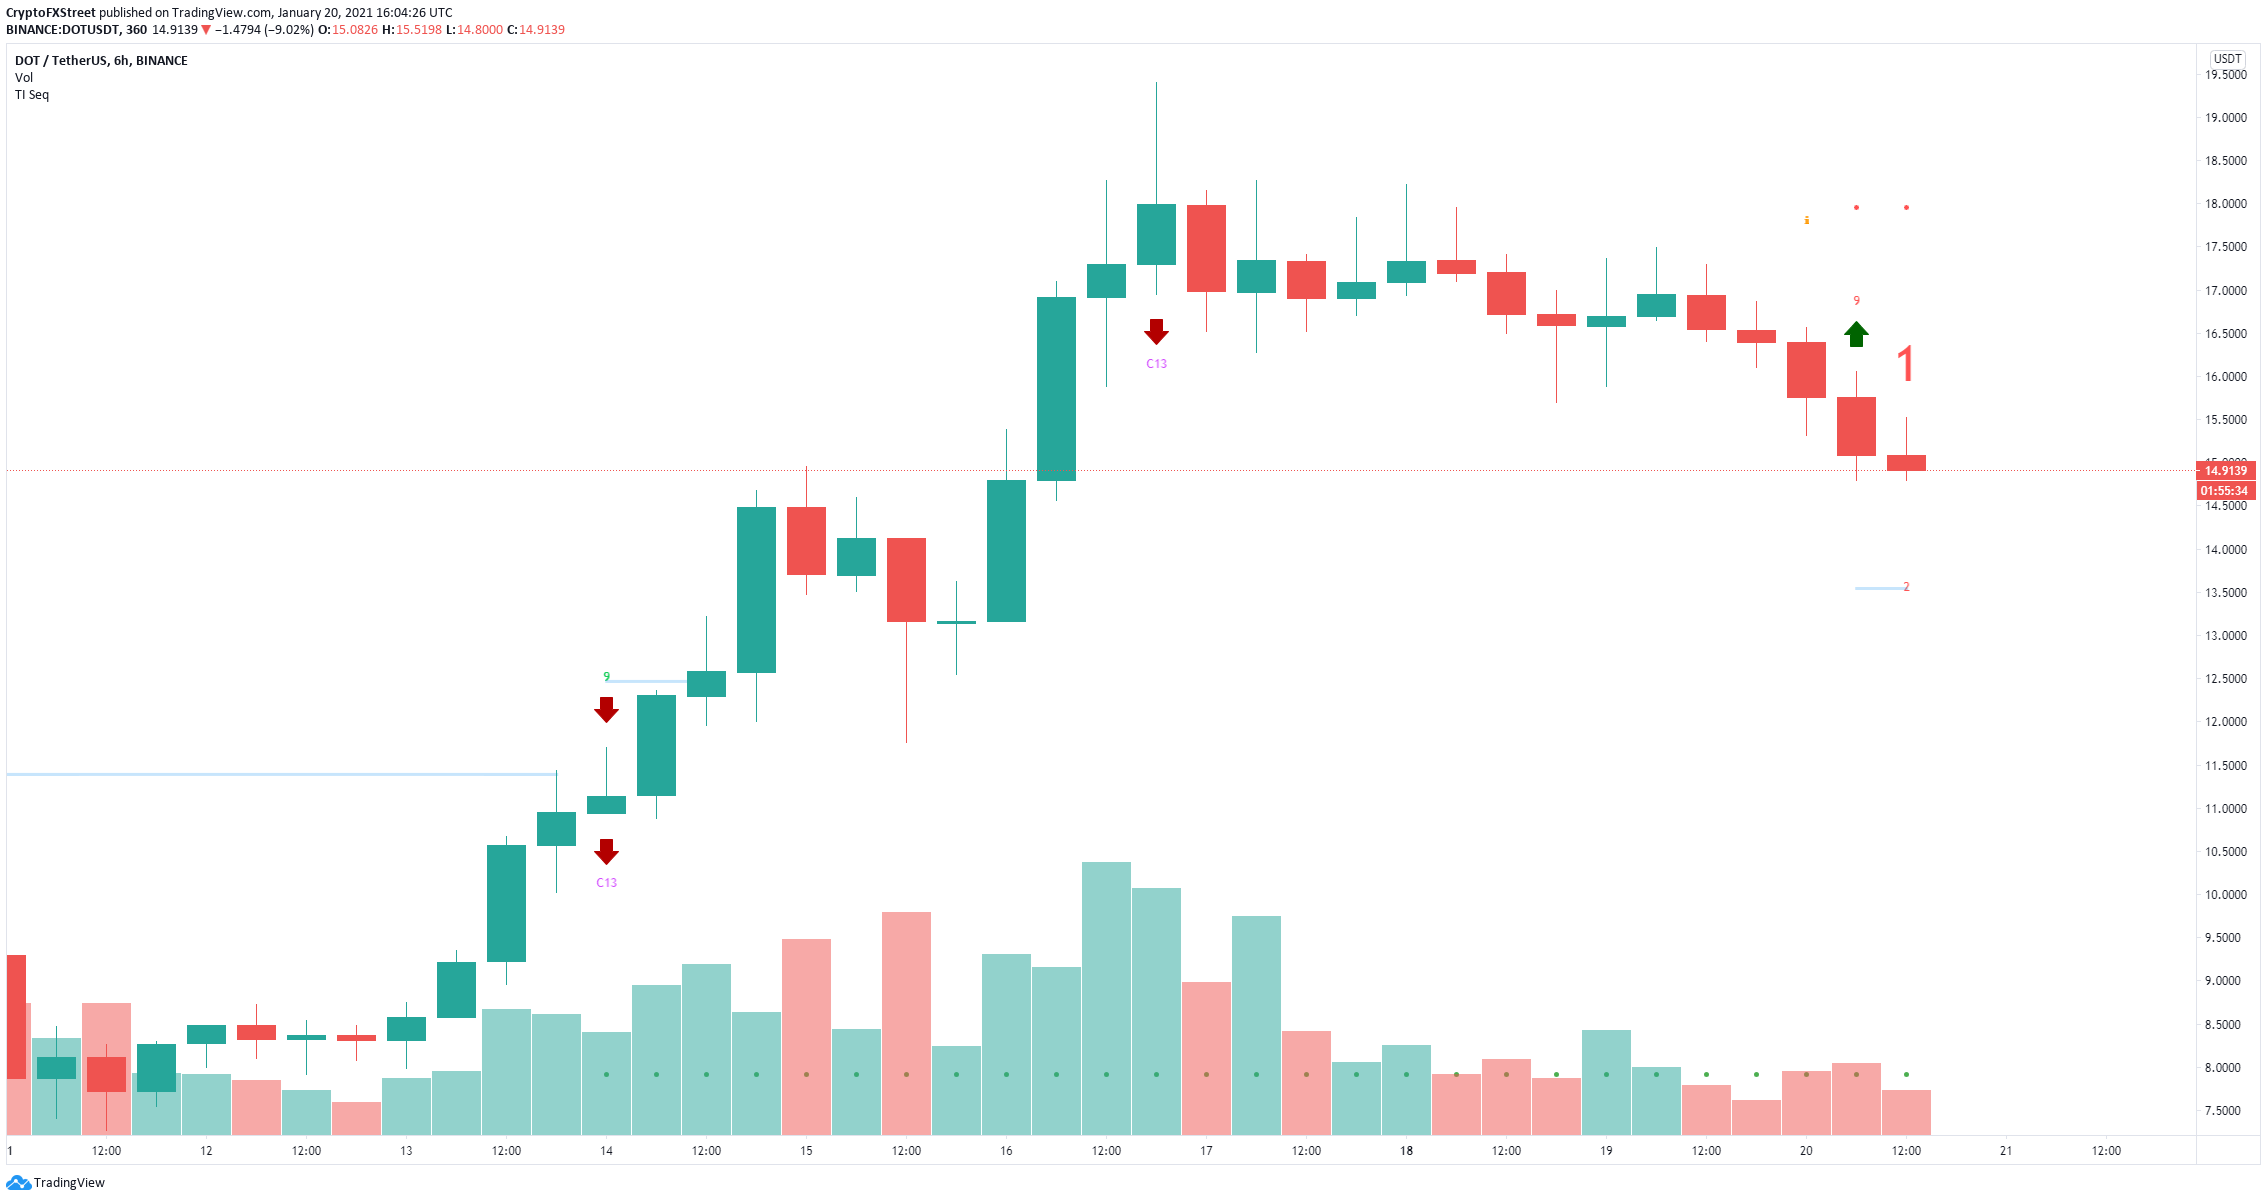
DOT/USD 6-hour chart

However, there is a chance for Polkadot price to rise higher in the short-term before another leg down. The TD Sequential indicator has just presented a buy signal on the 6-hour chart in the form of a red ‘9’ candlestick.

Author

Lorenzo Stroe

Lorenzo Stroe

Independent Analyst

Lorenzo is an experienced Technical Analyst and Content Writer who has been working in the cryptocurrency industry since 2012. He also has a passion for trading.

More from Lorenzo Stroe
Share:

Markets move fast. We move first.

Orange Juice Newsletter brings you expert driven insights - not headlines. Every day on your inbox.

By subscribing you agree to our Terms and conditions.

Editor's Picks

Crypto Today: Bitcoin, Ethereum, XRP trade under pressure amid mixed technical signals 

Bitcoin is trading above $90,000 at the time of writing on Tuesday amid sticky risk-off sentiment in the broader crypto market. Altcoins, including Ethereum and Ripple, are paring losses, holding above key support levels.

Bitcoin steadies above $90,000 as Fed rate-cut optimism lifts market sentiment

Bitcoin price holds above $90,000 on Tuesday after finding support around this key level. Firm expectations that the Fed will cut interest rates on Wednesday boosts investors' appetite for riskier assets such as BTC.

Pepe stalls as on-chain, derivatives data flash bullish signals

Pepe (PEPE) trades in the red on Tuesday after failing to secure a daily close above the $0.00000500 psychological level on Monday. The technical outlook remains mixed as the meme coin consolidates. 

Chainlink Price Forecast: LINK holds firm as reserves hit 16-month low

Chainlink price steadies near $13.70 on Tuesday, finding support around the key level. On-chain data signals bullish sentiment, as LINK exchange reserves fall to their lowest level since August 2024.

Orange Juice Newsletter – Smart insights by real people. Every day.

A free newsletter highlighting key market trends to help traders stay a step ahead. Daily insights on the most relevant trading topics, compiled by our experts in an easy-to-read format so you never miss an important move.

Crypto Today: Bitcoin, Ethereum, XRP pare gains despite increasing hopes of upcoming Fed rate cut

Bitcoin (BTC) is steadying above $91,000 at the time of writing on Friday. Resistance at $94,150 capped recovery on Wednesday, but in the meantime, bulls have contained downside risks above $90,000.