Polkadot price eyes a resounding bullish move after Tether news
- Polkadot is among a few top 100 cryptocurrencies in the green on Monday.
- Tether (USDT) minting on Polkadot blockchain returns DOT price in the limelight as investors take bullish positions.
- DOT price must break above a falling wedge pattern to validate a long-term bullish breakout.

Polkadot price is showing solid bullish strength on Monday after bears respected its support at $6.00. The parachains' token exchanges hands at $6.44 – and is among a handful of top 100 cryptocurrencies in the green. If volume continues to rise in its favor, DOT price will reach for a breakout above a falling wedge pattern on the daily chart.
Tether (USDT) starts minting on the Polkadot blockchain
The northbound move in Polkadot price may have stemmed from a late reaction to Tether's launch on its protocol. The leading stablecoin network announced on September 23 that USDT is mintable on the Polkadot blockchain.
Paolo Ardoino outlined via Twitter that "Polkadot is on a trajectory of growth and evolution this year and we believe Tether's addition will be essential in helping it continue to thrive." Polkadot price started responding positively to the news on the day the announcement was made, creating a bullish engulfing candle.
Resistance at $6.62 curtailed the uptrend as investors booked early profits. DOT price retreated to its previous support at $6.00 before breaking out in another bullish engulfing candle on Monday.
Read more: Polkadot price eyes retest of $7.5 amid increasing headwinds
Polkadot may be nearing a key juncture if a falling wedge pattern on the daily chart matures. Falling wedges are bullish patterns that often lead to a significant northbound trend reversal.
Traders should remember that the potential 27.33% breakout to $8.12 remains unconfirmed till Polkadot price breaks above the wedge's upper trendline. The OBV (On Balance Volume) indicator validates the growing bullish influence. Polkadot price will continue grinding to the upside as long as the OBV is up-trending.
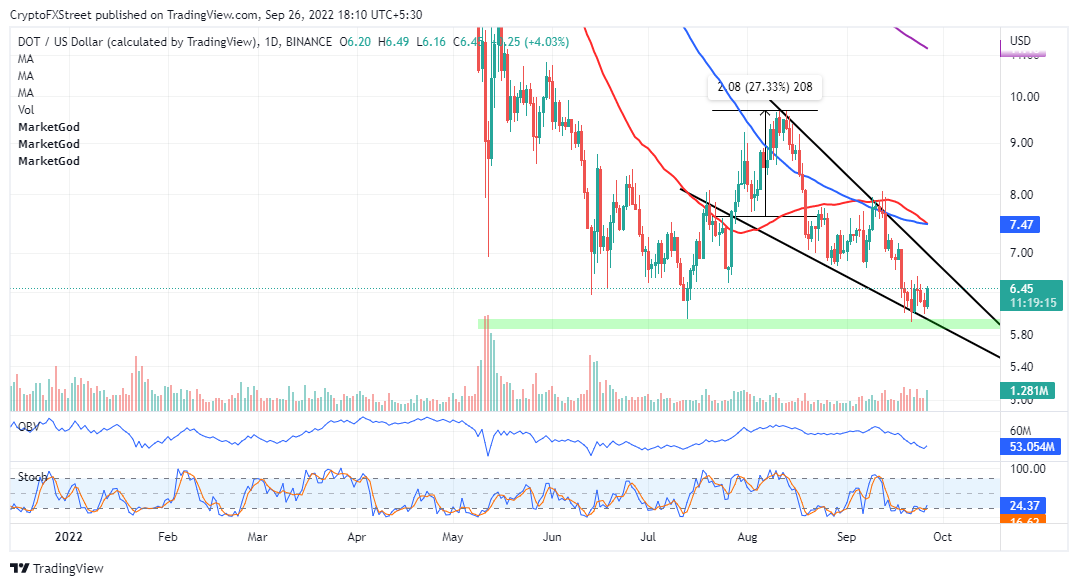
DOT/USD daily chart
Adding credence to the bullish analysis is the Stochastic oscillator as it lifts from the oversold region (30.00 to 0.00). Additionally, a recently established positive divergence may continue to nurture an optimistic outcome for Polkadot price.
The 50-day SMA (Simple Moving Average –red) may invalidate DOT's new uptrend if it crosses below the longer-term 100-day SMA (blue). Support is expected at $6.00 and must be defended at all costs to avert further losses.
Read more: Polkadot Price Prediction: Is this the entry position traders have been waiting for?
Author

John Isige
FXStreet
John Isige is a seasoned cryptocurrency journalist and markets analyst committed to delivering high-quality, actionable insights tailored to traders, investors, and crypto enthusiasts. He enjoys deep dives into emerging Web3 tren


