Polkadot Price Analysis: DOT on the threshold of another 40% decline
- Polkadot price closing in on a breakout from a bear flag pattern.
- A decline to the DOT measured move target would erase the majority of the 2021 gains.
- The 78.6% Fibonacci retracement level at $11.96 may prevent a significant decline.

Polkadot price executed a timid rebound off the June 22 low, traversing a bear flag pattern marked by no end of the day commitment and well below-average volume. Today’s decline may force a breakout from the pattern, putting DOT on course to record a 40% move from the flag’s lower trend line.
Polkadot price structure indicates the ground floor is still far away
Polkadot price recorded one of the largest 2Q declines at 56%, shredding the support offered by the 200-day simple moving average (SMA) and most key Fibonacci retracement levels. The DOT response to the second quarter collapse was a corrective rebound of 40%, illustrating a bear flag pattern on multiple timeframes.
The measured move of the bear flag pattern is approximately 40%, presenting a Polkadot price target of $8.85. A decline of that magnitude would overwhelm the layers of support provided by the May 23 low of $13.59, the June 22 low of $12.75 and the 78.6% retracement level of the rally beginning in August 2020 at $11.96. In fact, the drop would nearly eliminate all the gains achieved by DOT in 2021, representing a major setback for the cryptocurrency.
If Polkadot price registers a daily close below the flag’s lower trend line, currently at $14.70, it will have an inevitable bearish outcome for DOT. A spike in volume should accompany the breakout, further confirming the bearish forecast.
Adding some validity to a projection of a 40% decline is that Polkadot price recently plunged by a similar percentage between July 19 and July 22 after a breakout from a symmetrical triangle pattern. Thus, the precedent is in place for another DOT sell-off.
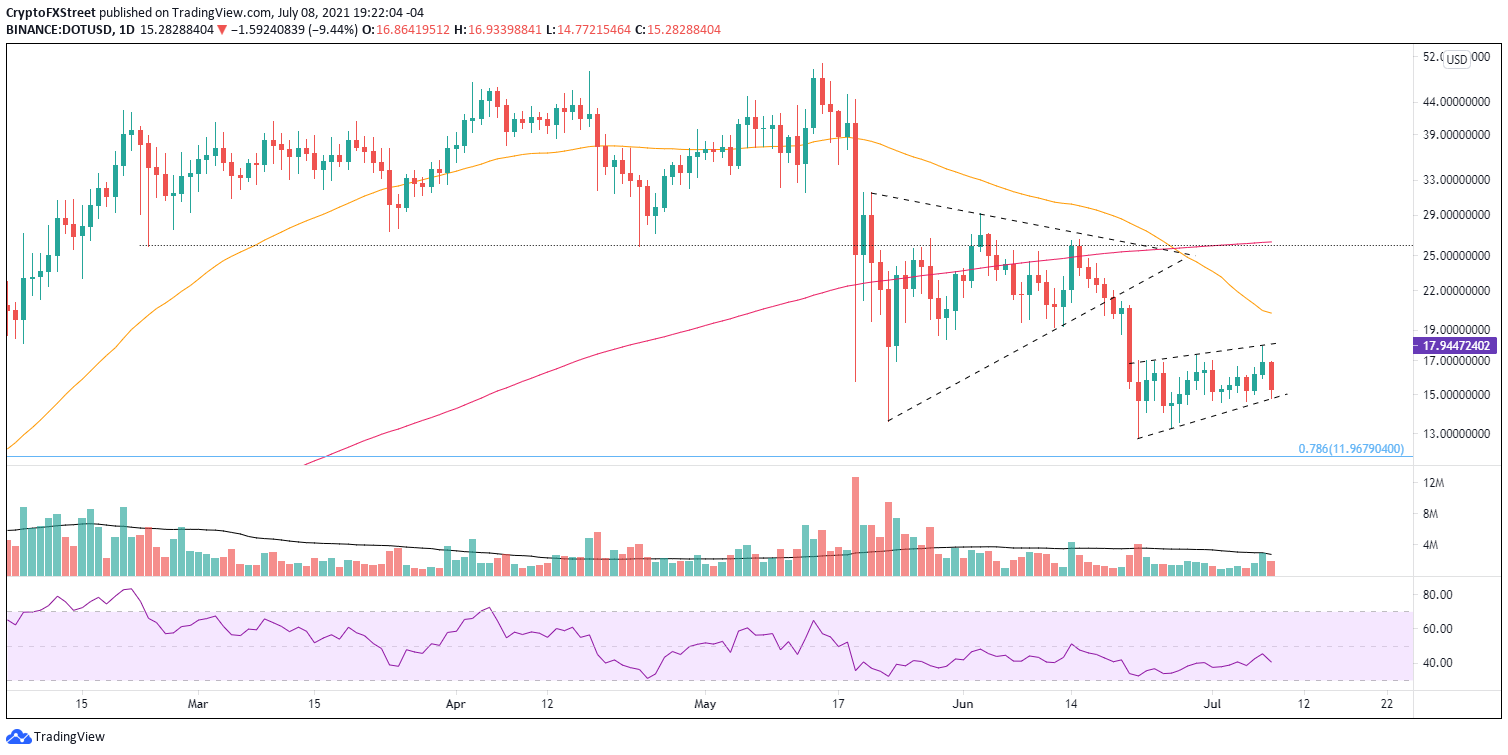
DOT/USD daily chart
A daily close above the flag’s upper trendline, currently at $17.90, would negate the bearish forecast and suggest that Polkadot price seeks at least a test of the declining 50-day SMA at $20.24. Any further DOT upside will be challenged by the downward pressure of the moving average and the recent bearish Death Cross pattern triggered on June 27.
To be sure, Polkadot price has established the precedent of sharp, outsized declines since the top on May 15, and it should not be ignored. Hence, market operators have nothing to lose by being patient until the bear flag pattern resolves and reaches the ground floor. Of course, they could be stubborn and stand in the way of another 40% downturn.
Author

Sheldon McIntyre, CMT
Independent Analyst
Sheldon has 24 years of investment experience holding various positions in companies based in the United States and Chile. His core competencies include BRIC and G-10 equity markets, swing and position trading and technical analysis.


