Polkadot Price Analysis: DOT bears not ready to relax their ambitions
- Polkadot price releases from the second continuation pattern in the last 20 trading days, revealing limited investor engagement with the digital asset.
- Bearish Death Cross triggered on June 27 introduces a new barrier to sustainable price traction should a rebound materialize.
- The June 22 low of $12.75 represents the line in the sand for this leg lower of the DOT correction.

Polkadot price did not deviate from the mild rebounds underpinning most cryptocurrencies off the June 22 low. It was a particular disappointment for committed DOT investors and laid the groundwork for the recent breakout from a bear flag pattern on July 8. The breakdown is gaining momentum and suggests that the altcoin may reach new correction lows in the coming days.
Polkadot price still cannot be trusted at current levels
The bear flag pattern that triggered on July 8 when Polkadot price fell below the flag’s lower trend line was the culmination of a grind higher, reflecting no investor interest to capitalize on the lower prices, despite a decline of approximately -75% from the May high of $50.74.
The measured move target of the bear flag pattern has two alternatives. The first is the June 22 low of $12.75, presenting a 15% decline from the original entry price. The second, and far more aggressive, is the price target of $9.09, representing a 40% decline from the entry price on July 8. The 40% is the distance from the flag trough to high.
A Polkadot price decline of 40% would wipe out the support offered by the 78.6% retracement level of the advance beginning in August 2020 and ending at the May high of $50.74. Moreover, it would be an 82% decline from the May 15 high and eliminate all of the 2021 gains going back to mid-January.
If there any doubts above the potential for a 40% collapse, please refer to the DOT breakdown from a symmetrical triangle pattern on June 18. Polkadot price fell approximately 40% over the next four days, establishing a precedent for the current situation.
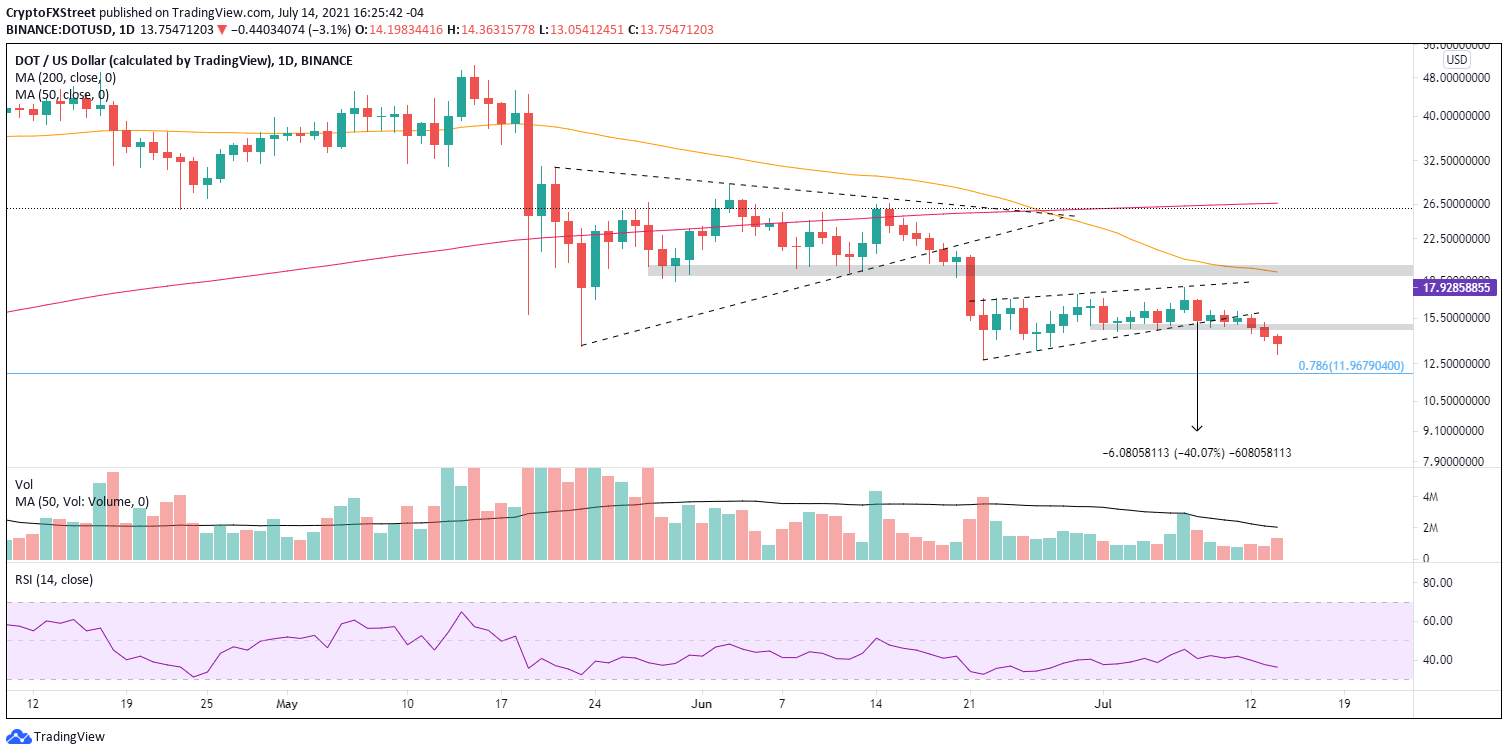
DOT/USD daily chart
To re-establish confidence in DOT, Polkadot price needs to capture a daily close above $14.85. A successful close would introduce the potential for the altcoin to climb to the strong resistance of the 50-day simple moving average (SMA) at $19.25, which harmonizes with a series of wicks in late May and early June. Even so, it would yield a 30% gain from the $14.85 trigger price.
Polkadot price momentum remains down with no definitive clues of when the bears will relax their ambitions. Still, the looming June 22 low at $12.75 may offer credible support and facilitate a bear trap that would immediately catapult DOT higher in a sling-shot formation. For now, if you are not actively trading the digital asset, it is best to be patient and let the mentioned price levels dictate your capital allocation
Author

Sheldon McIntyre, CMT
Independent Analyst
Sheldon has 24 years of investment experience holding various positions in companies based in the United States and Chile. His core competencies include BRIC and G-10 equity markets, swing and position trading and technical analysis.


