Polkadot nurtures a 15% breakout while this crucial barrier must come down
- Polkadot rebounds from support at $8.0 as bulls target gains to $10.
- Trading volume is building according to the data provided by Santiment; upward price action likely to continue.

Polkadot has embarked on another recovery mission after embracing $8 during the recent widespread declines. As the price inches closer to the ultimate breakout point, DOT bulls are getting ready for a massive liftoff, likely to test $10.
Polkadot prepares for the uplift to $10
DOT/USD is doddering at $8.7 amid a renewed bullish momentum. On the downside, the ascending parallel channel’s middle boundary is holding the token in position. On the upside, Polkadot is making the final approach at the upper resistance. A break above the crucial resistance (channel’s upper boundary) would elevate Polkadot toward the coveted $10.
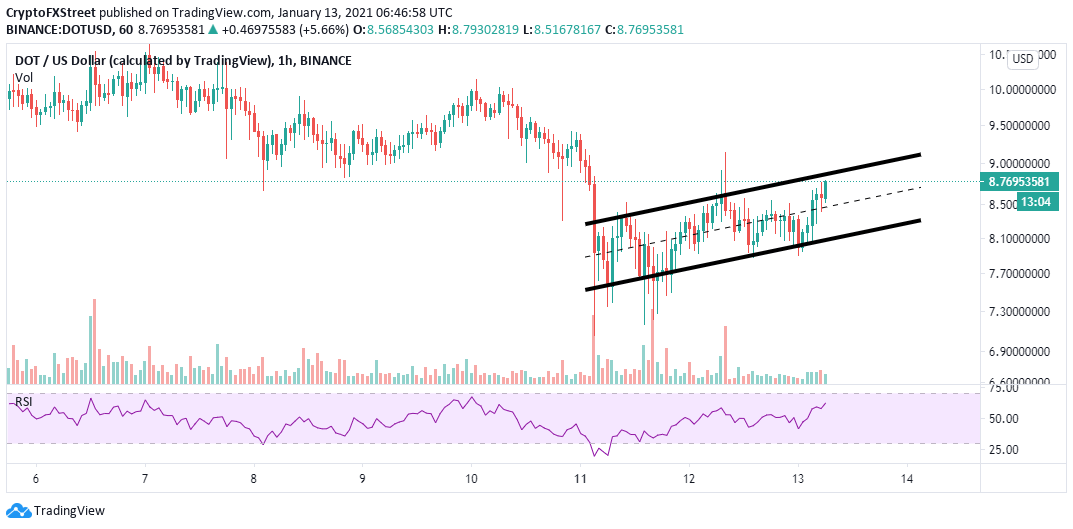
DOT/USD 1-hour chart
The 4-hour chart highlights that the prevailing trend favors the bulls. The Relative Strength Index has broken above the bearish divergence, which explains the intraday spike.
A bearish divergence comes into the picture when the price forms a series of higher lows while the RSI drops, creating a series of lower highs. It represents decreasing volume but once broken, buyers begin to regain control over the price, as observed on the chart.
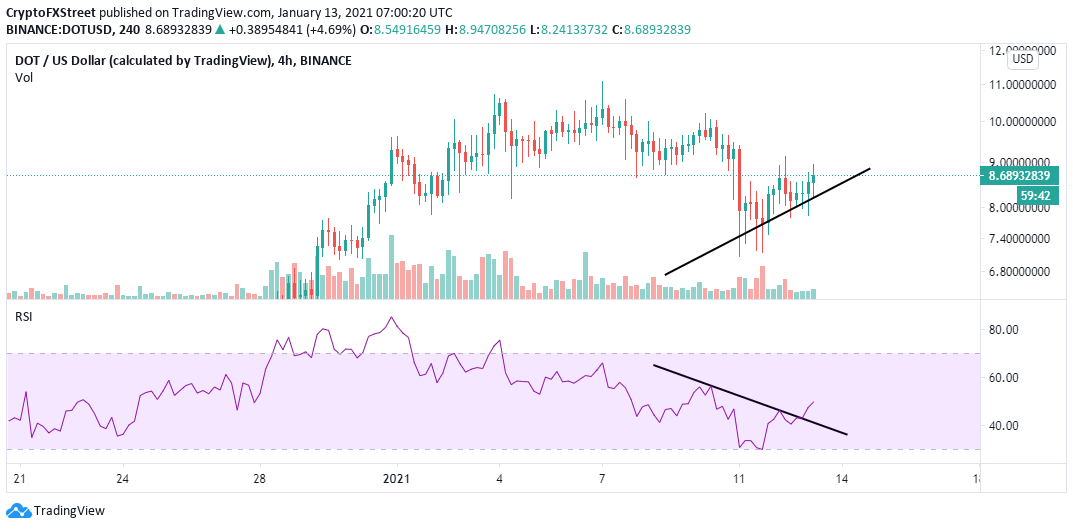
DOT/USD 4-hour chart
Santiment, a leading on-chain analysis platform, shows that Polkadot’s daily trading volume is starting to rise again after topping out at $3.5 billion on January 4. The volume dropped significantly over the last weekend and early this week to $1.4 billion.
However, the on-chain metric confirms that DOT’s volume is recovering but holding at $1.9 billion at writing. As the volume rises, the price is likely to follow, similar to the token’s past performance.
%20[10.07.28,%2013%20Jan,%202021]-637461195659027270.png)
Polkadot daily volume chart
It is worth mentioning that the bullish outlook will be jeopardized if DOT/USD fails to break above the channel’s upper boundary. The price must also settle above $9 to sustain the uptrend eyeing $10. On the downside, a correction may come into the picture as overhead pressure intensifies, thus revisiting the support at $8.5 and $8.0, respectively.
Author

John Isige
FXStreet
John Isige is a seasoned cryptocurrency journalist and markets analyst committed to delivering high-quality, actionable insights tailored to traders, investors, and crypto enthusiasts. He enjoys deep dives into emerging Web3 tren




