Pi Network Price Forecast: Downside risk escalates in PI as breakout rally cools off
- PI edges lower towards the $0.3700 support, which previously acted as the neckline of an Adam and Eve pattern.
- Trading volume has decreased by nearly 30% in the last 24 hours.
- The technical outlook flashes the risk of a 10% decline if the bullish pattern’s neckline fails to hold, as previously seen in mid-July.

Pi Network (PI) retraces under $0.4000 at press time on Tuesday, following its peak at $0.4661 on Sunday. The technical outlook suggests a bearish bias as trading volume decreases, with increasing chances of a 10% correction similar to the one seen in mid-July.
Pi Network’s downside risk escalates
The Pi token has dropped by over 3% so far on Tuesday, extending the downtrend that began with the 9% decline on Sunday. The Adam and Eve pattern breakout rally in PI fails to sustain above the 200-period Exponential Moving Average (EMA) at $0.4253 on the 4-hour chart (shared below). This results in a bearish turnaround, breaking below the $0.4000 support and the 50-period EMA at $0.3884.
PI trading volume is down by nearly 30% over the last 24 hours, signaling weaker market participation as traders take a wait-and-see approach.
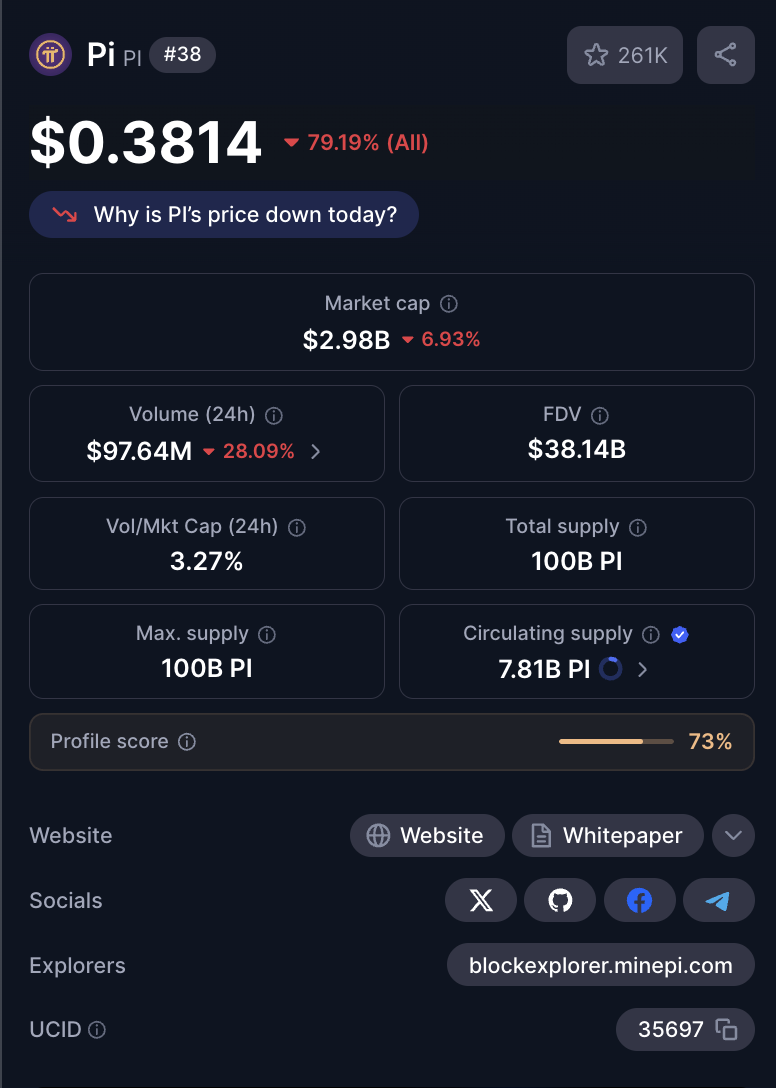
Pi Network market statistics. Source: CoinMarketCap
The sudden shift mimics the price action of the previous Adam and Eve pattern breakout seen in mid-July, when Pi reversed from the 200-period EMA to invalidate the neckline, back then at $0.4734, resulting in a 10% extended correction. Investors must remain cautious as PI retraces towards the current neckline at $0.3700, which increases the risk of a similar move.
A 10% drop from the $0.3700 neckline would likely test the $0.3334 support level, marked by last Wednesday’s low.
The momentum indicators turn grim as the selling pressure builds up, with the Relative Strength Index (RSI) crossing below its central line on the 4-hour chart. Currently, the RSI stands at 43, suggesting further room for correction before reaching oversold conditions.
Similarly, the Moving Average Convergence Divergence (MACD) indicator displays a declining trend in the average lines after the sell signal from Monday. A renewed wave of red histogram bars below the zero line indicates a rise in bearish momentum.
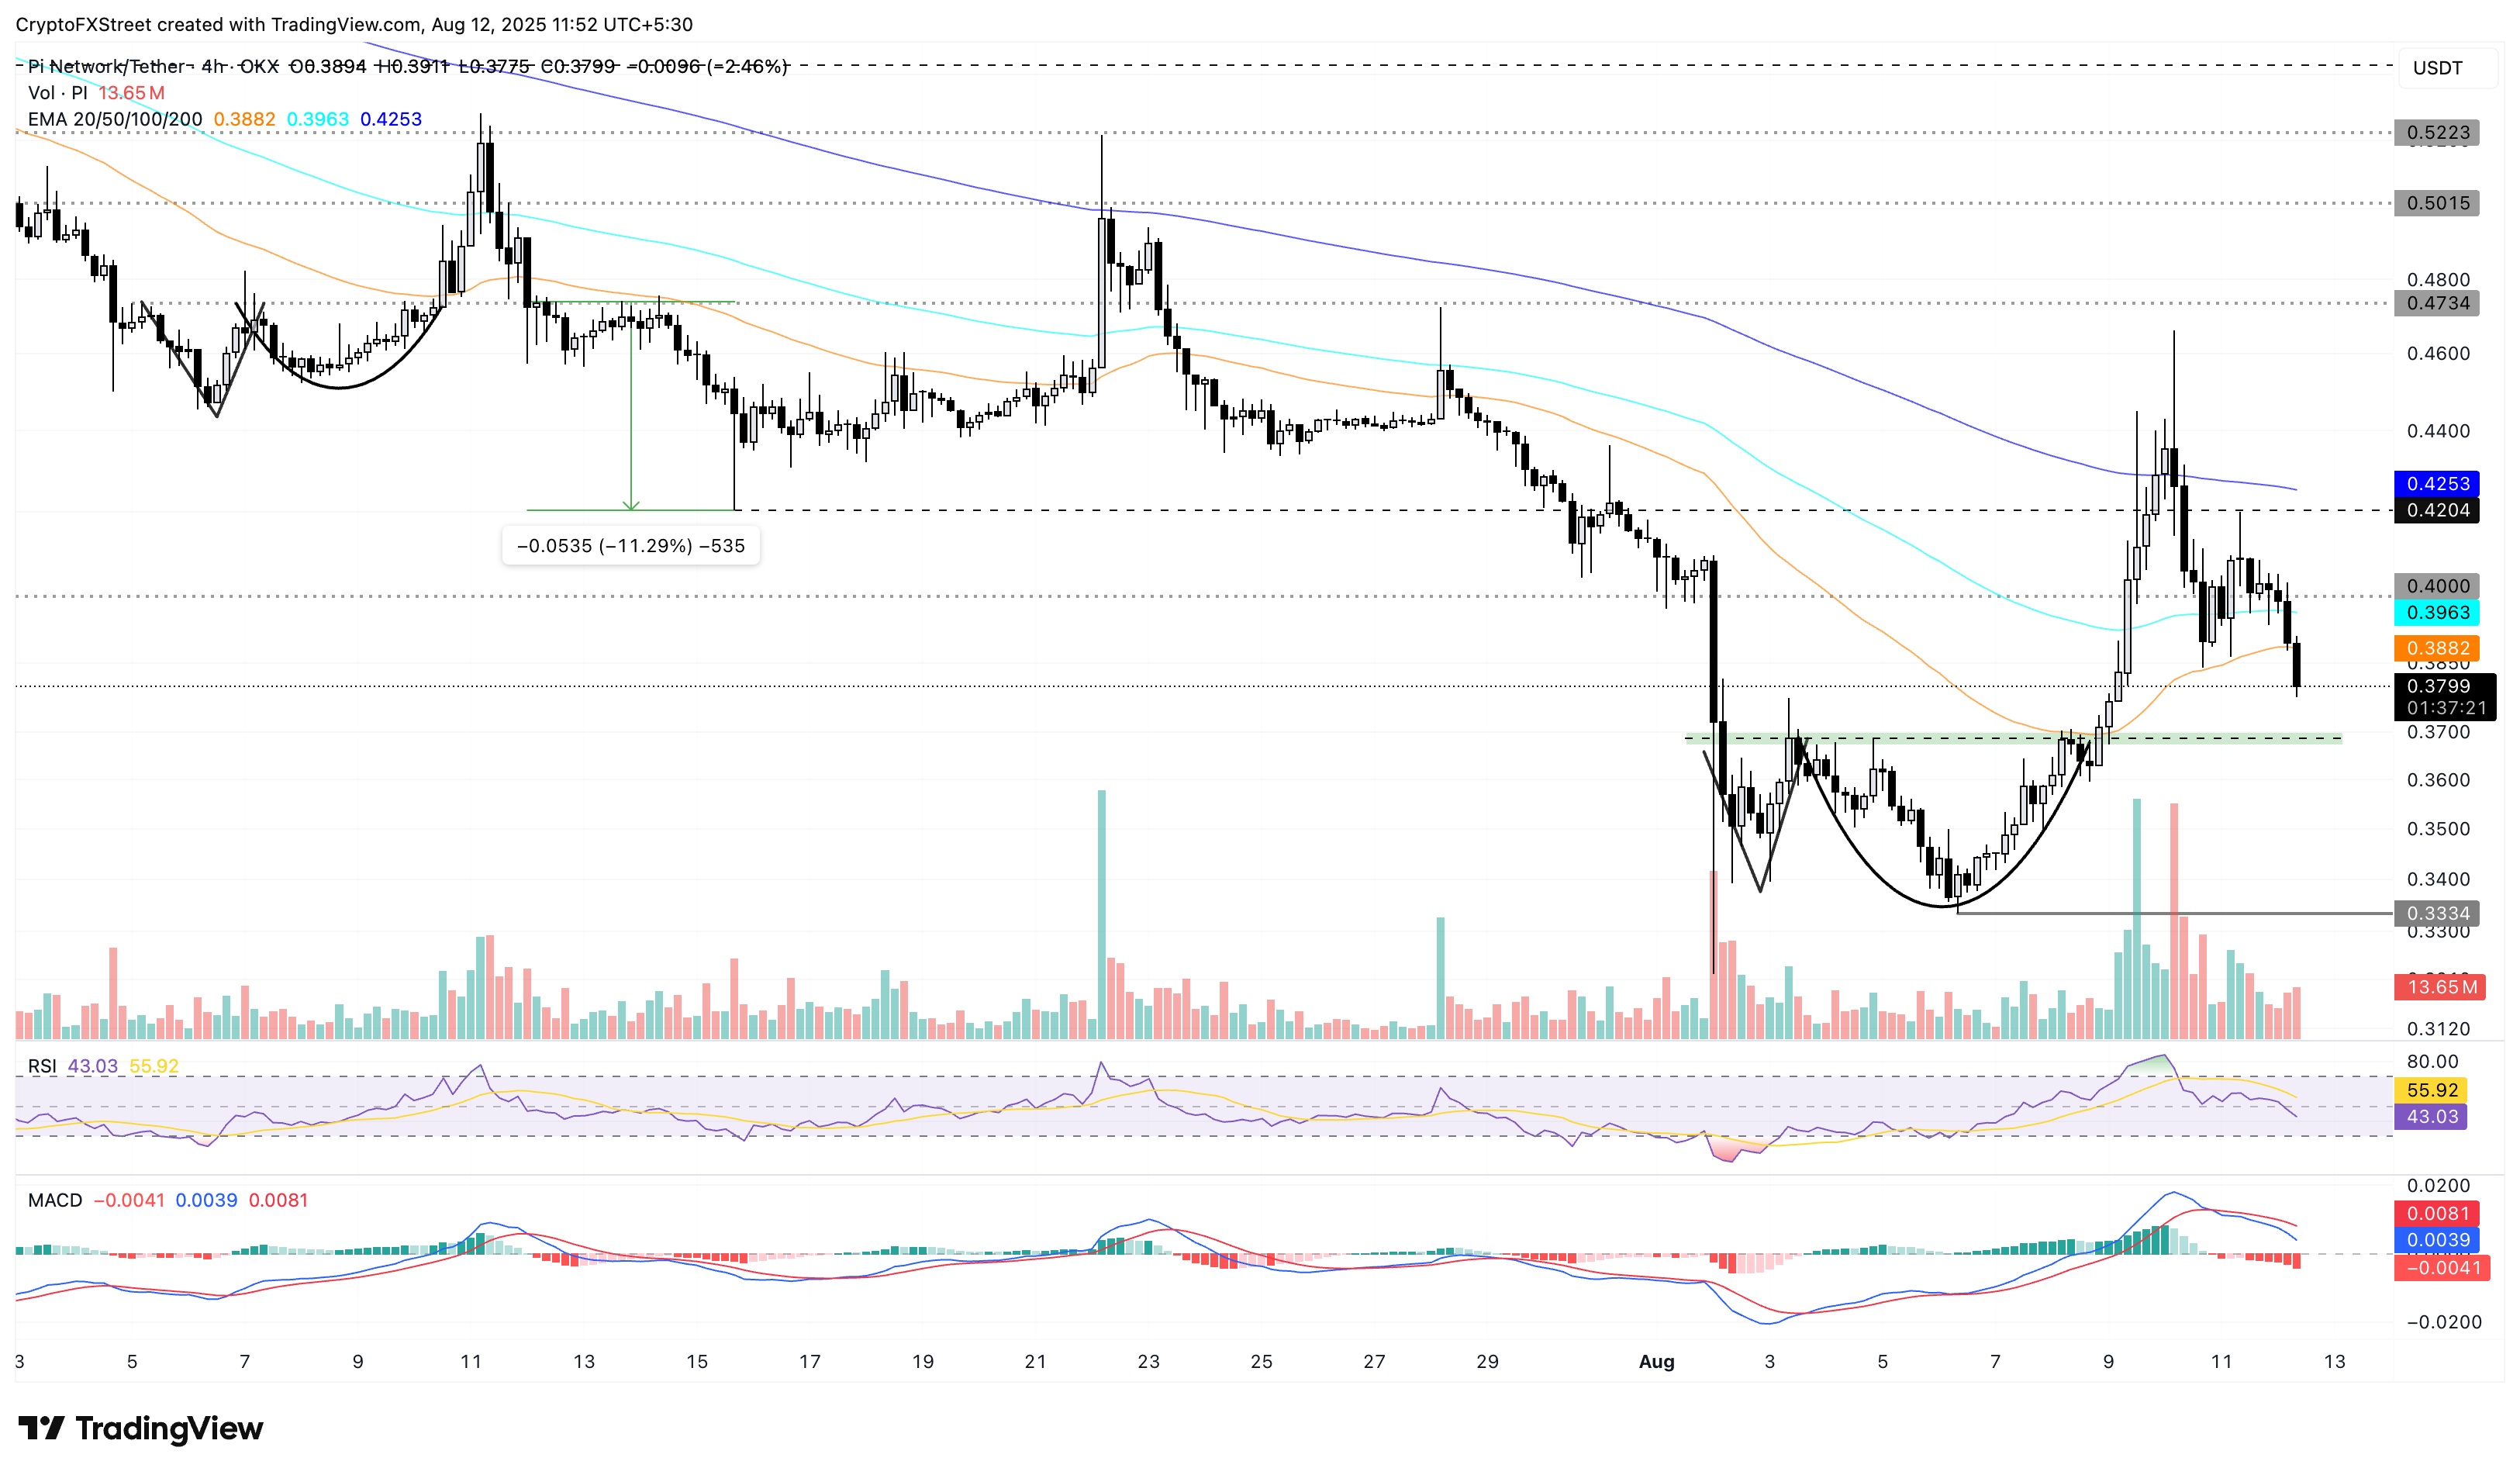
PI/USDT daily price chart.
Looking up, Pi Network should reclaim the $0.4000 level to revive bullish reversal chances and target the next key resistance, the 200-period EMA at $0.4253.
Open Interest, funding rate FAQs
Higher Open Interest is associated with higher liquidity and new capital inflow to the market. This is considered the equivalent of increase in efficiency and the ongoing trend continues. When Open Interest decreases, it is considered a sign of liquidation in the market, investors are leaving and the overall demand for an asset is on a decline, fueling a bearish sentiment among investors.
Funding fees bridge the difference between spot prices and prices of futures contracts of an asset by increasing liquidation risks faced by traders. A consistently high and positive funding rate implies there is a bullish sentiment among market participants and there is an expectation of a price hike. A consistently negative funding rate for an asset implies a bearish sentiment, indicating that traders expect the cryptocurrency’s price to fall and a bearish trend reversal is likely to occur.
Author

Vishal Dixit
FXStreet
Vishal Dixit holds a B.Sc. in Chemistry from Wilson College but found his true calling in the world of crypto.


