Pi Network Price Analysis: Bearish pattern deepens as CEX outflows rise
- Pi Network’s reversal from the 50-day EMA marks the beginning of a potential downcycle within a falling channel pattern.
- The trading volume data of the PI token reflects stagnation.
- The CEXs' wallet balances dropped by 2.88 million in the last 24 hours.

Pi Network (PI) edges lower by 3% at press time on Monday, extending the 8% drop from Sunday within a bearish pattern on the daily chart. The downfall aligns with the stagnation in trading volume, suggesting a cooling off in traders’ activity. However, a significant net outflow from the centralized exchanges' (CEXs) wallet balances in the last 24 hours signals confidence among traders.
CEXs' outflow signals a bullish intent among traders
PiScan data shows the wallet balances of CEXs dropping by 2.88 million PI tokens over the last 24 hours, reaching a 420.90 million PI balance. Out of the five Know Your Business (KYB) aligned exchanges by Pi Foundation, the OKX exchange marked the largest outflow of 3.79 million PI tokens.
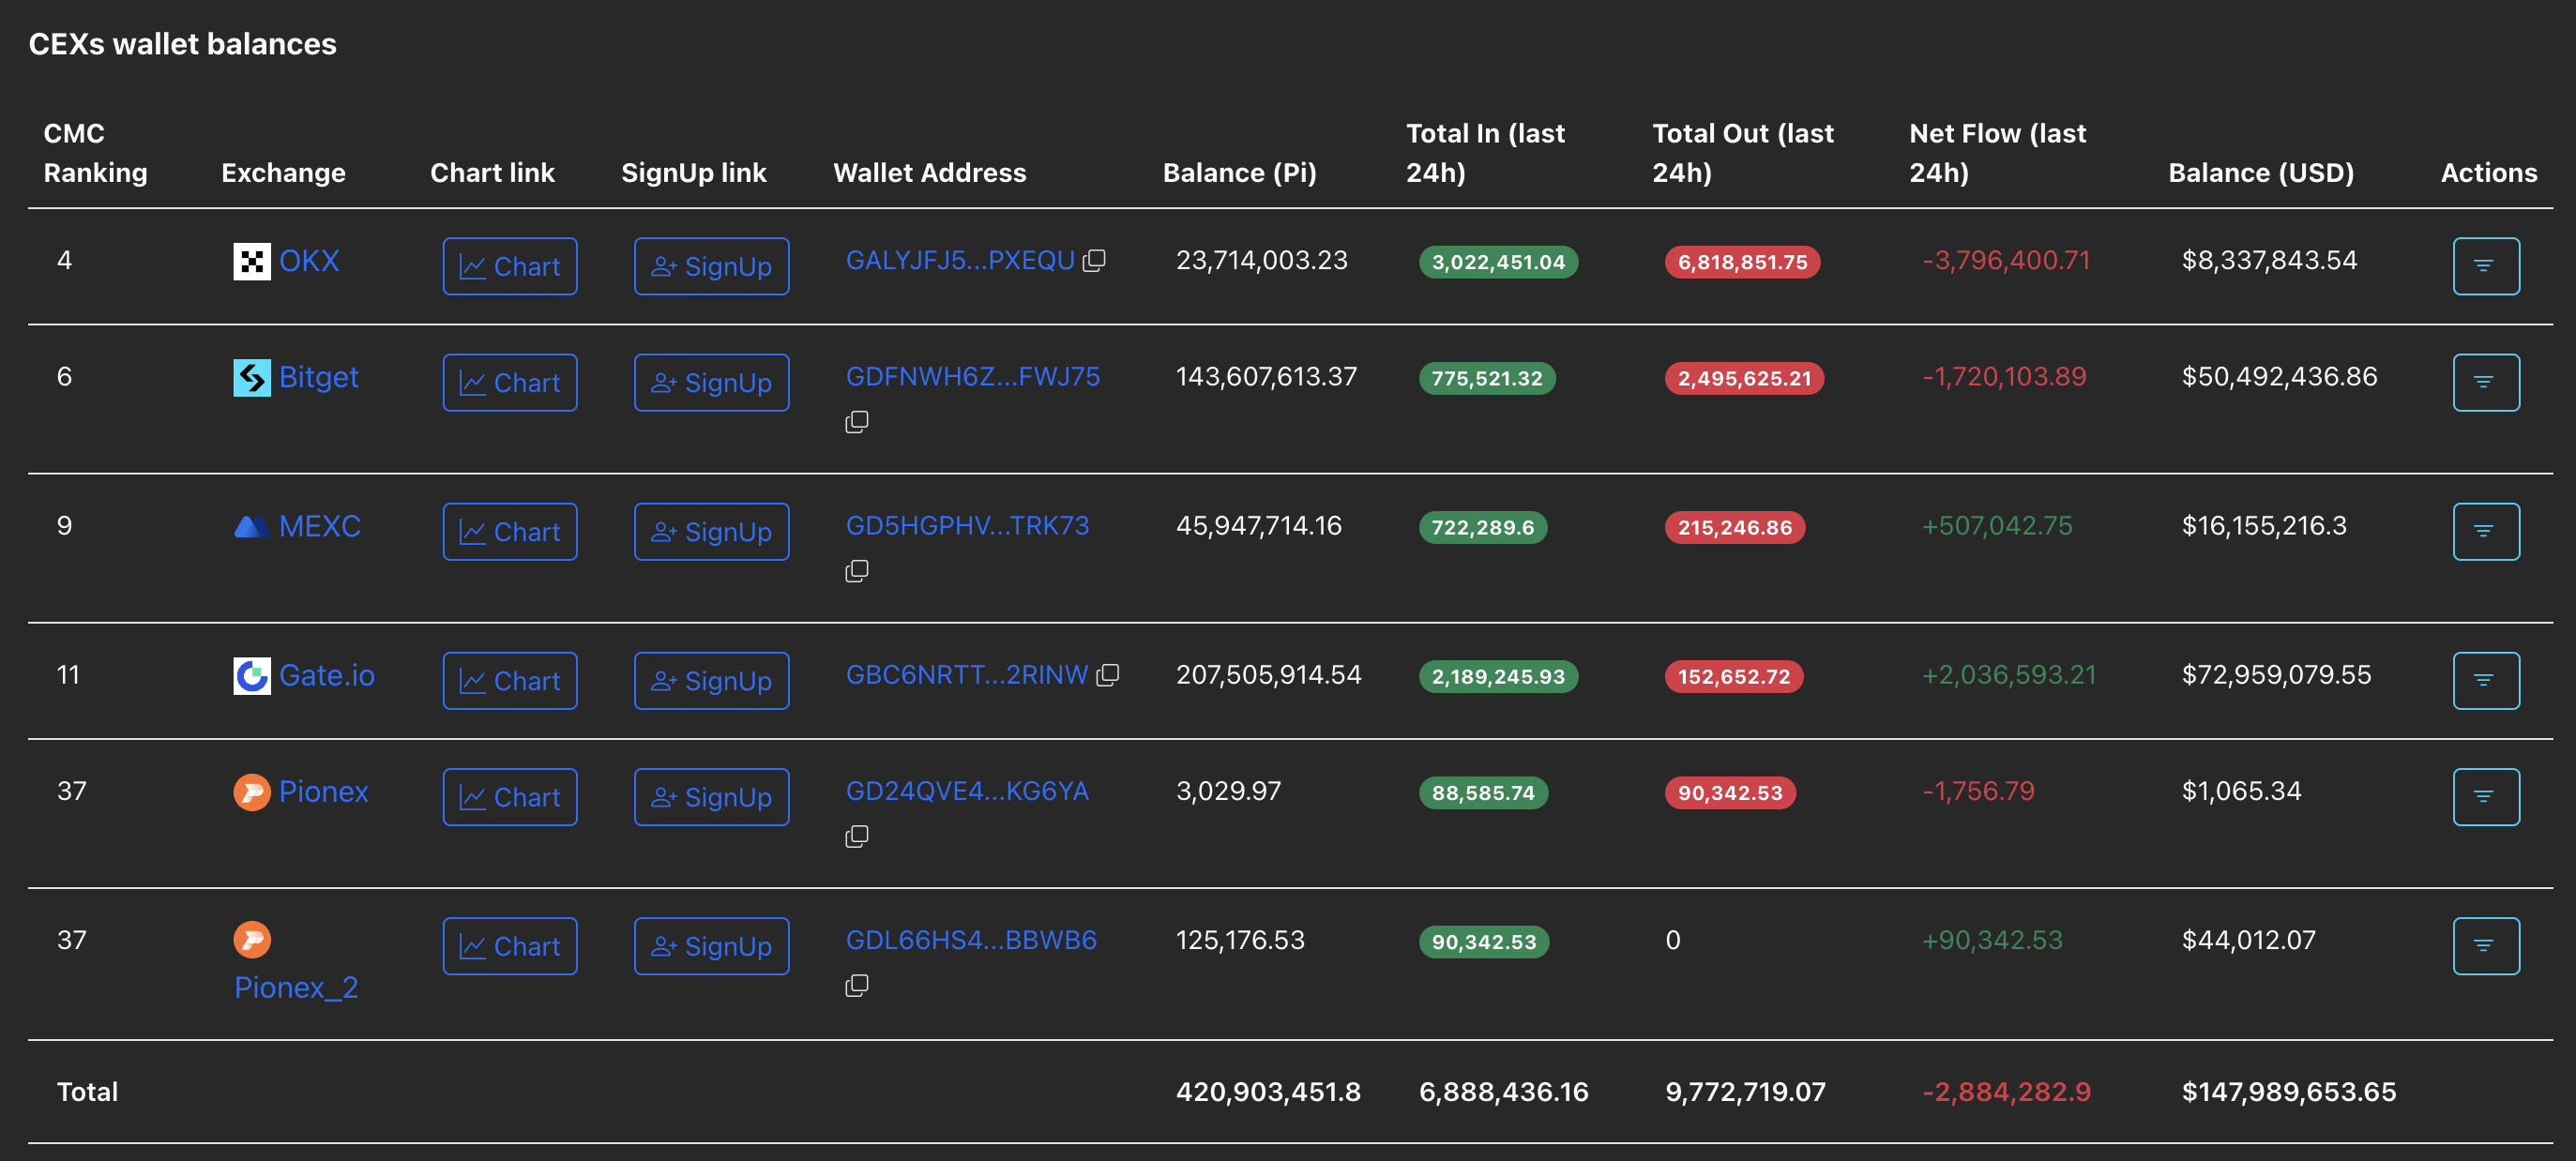
CEXs' wallet balances. Source: PiScan
The massive outflow indicates heightened withdrawals from the CEXs, signaling confidence among traders. Still, the Artemis data on daily PI token trading volume suggests a potential stagnation between $50 million and $100 million since mid-August.
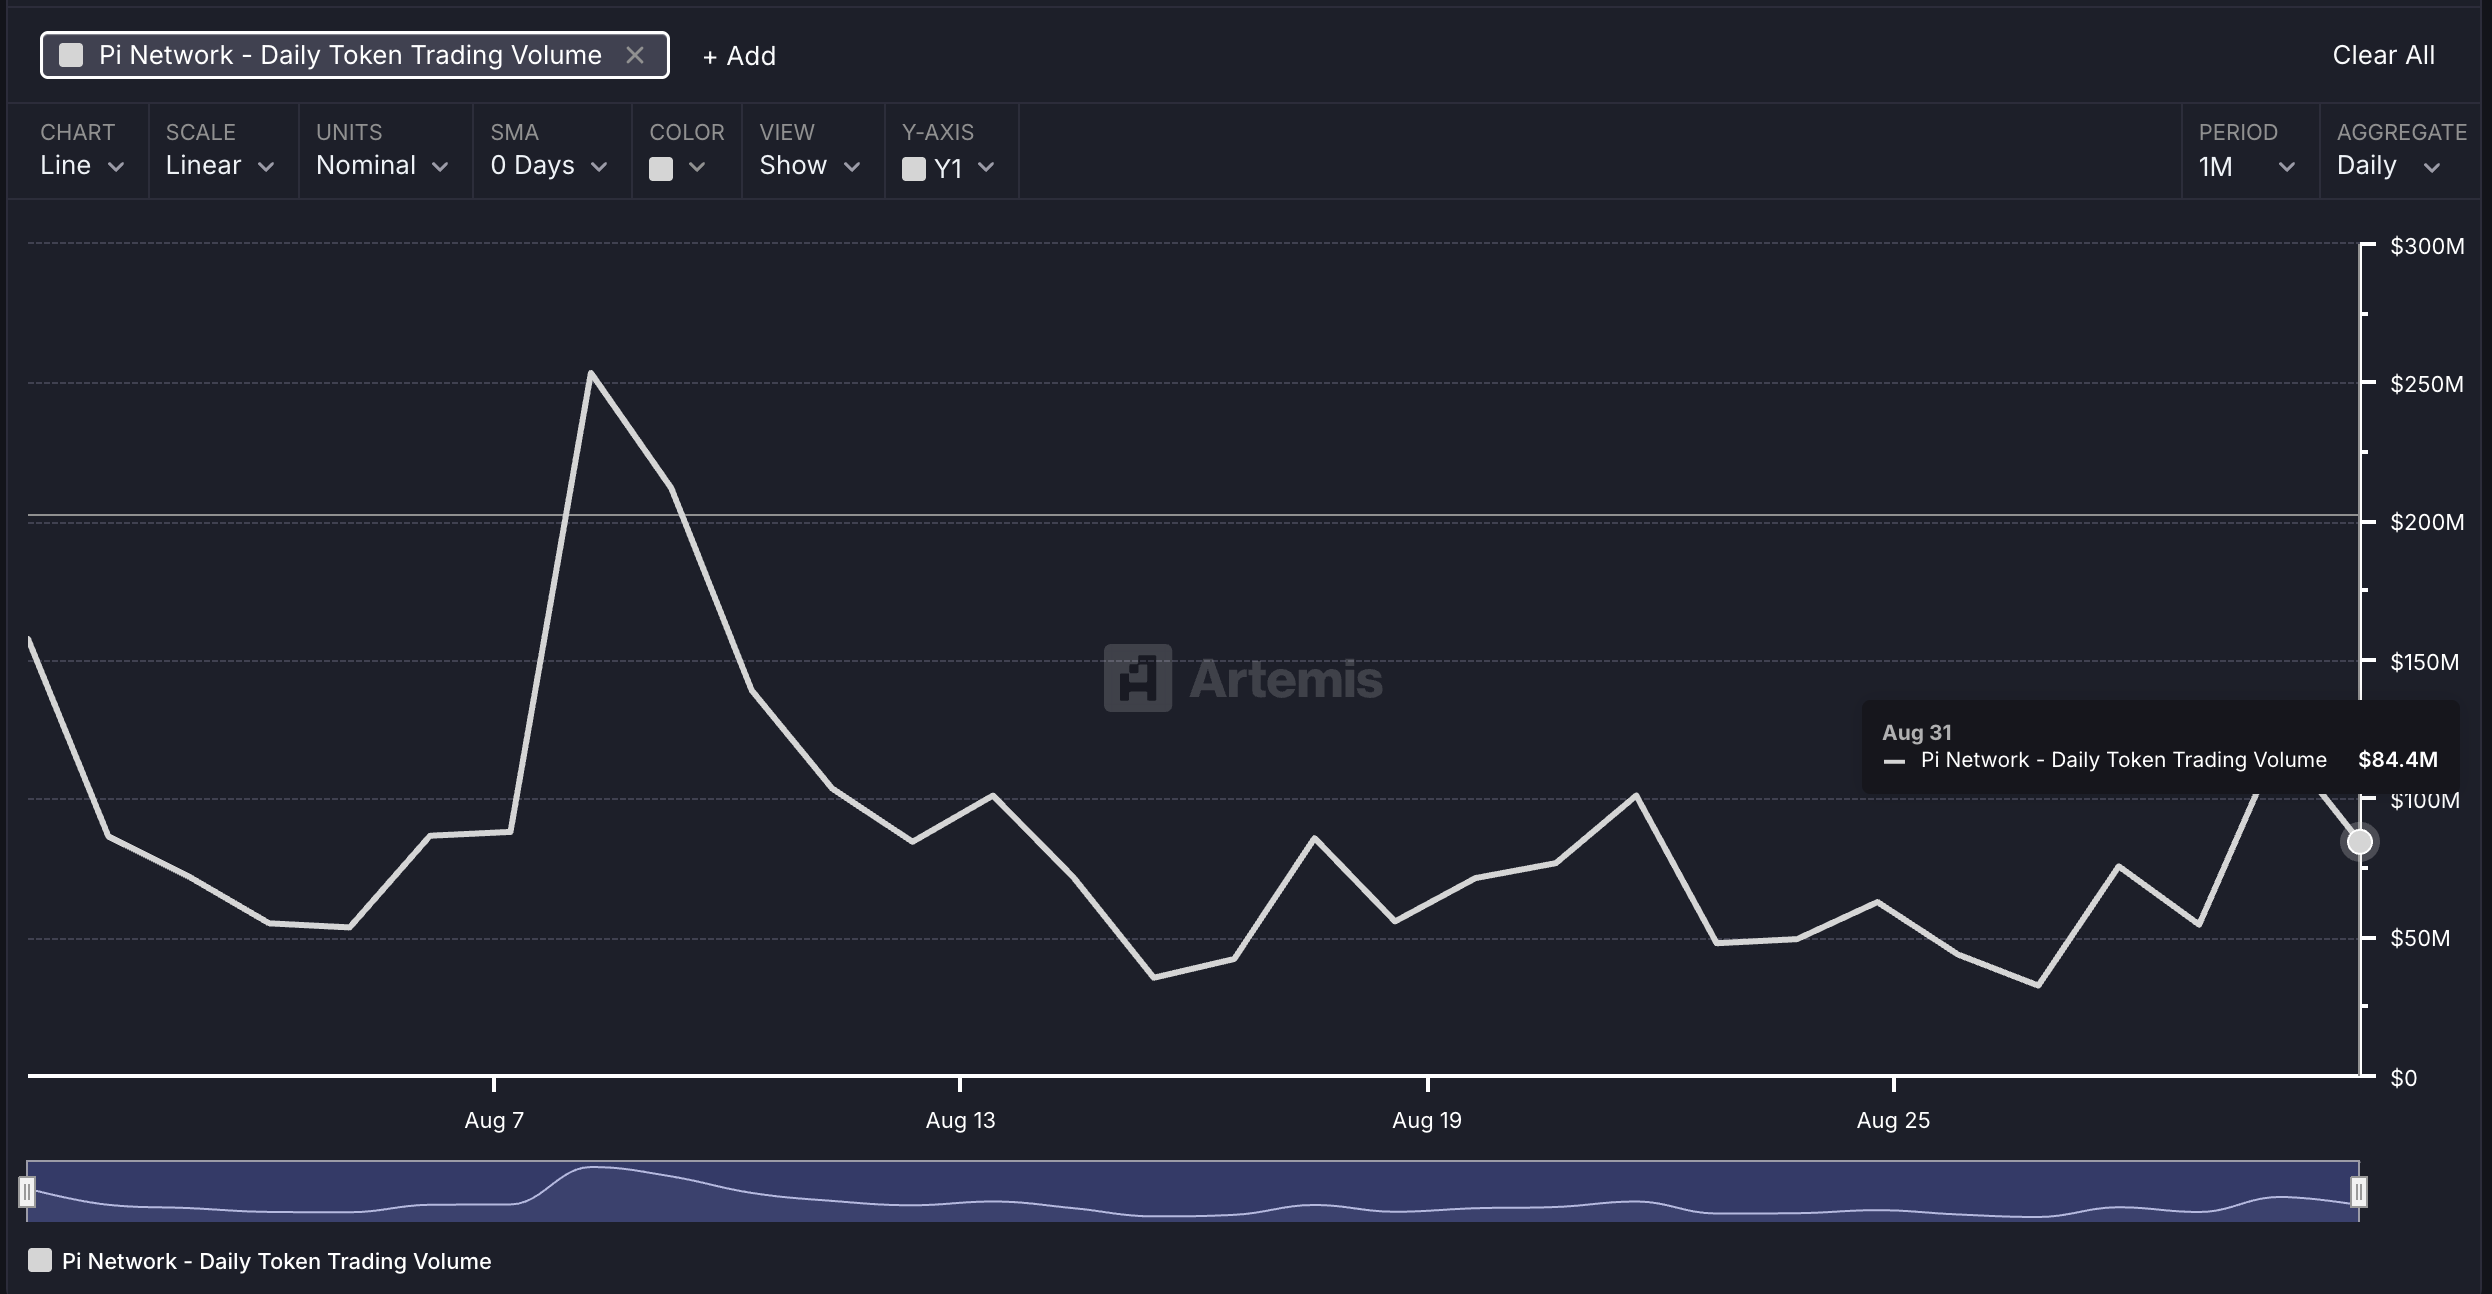
PI token daily trading volume. Source: Artemis
PI struggles with a falling channel pattern breakout
Pi Network’s short-lived recovery run in the last week peaked at $0.4000 round figure on Saturday. The PI token reversed by 8% on Sunday, further extending the downtrend by 3% so far on Monday.
The downtrend inches closer to its all-time low of $0.3220, set on August 1, with bears targeting the $0.3000 round figure.
Adding to the bearish outlook, the momentum indicators suggest increased selling pressure on the daily chart. The Relative Strength Index (RSI) at 43 drops below the halfway line, indicating a steady rise in bearishness.
Additionally, the Moving Average Convergence Divergence (MACD) inches closer to its signal line as bullish momentum declines, hinting at a potential crossover. A crossover would signal a selling opportunity for sidelined investors.
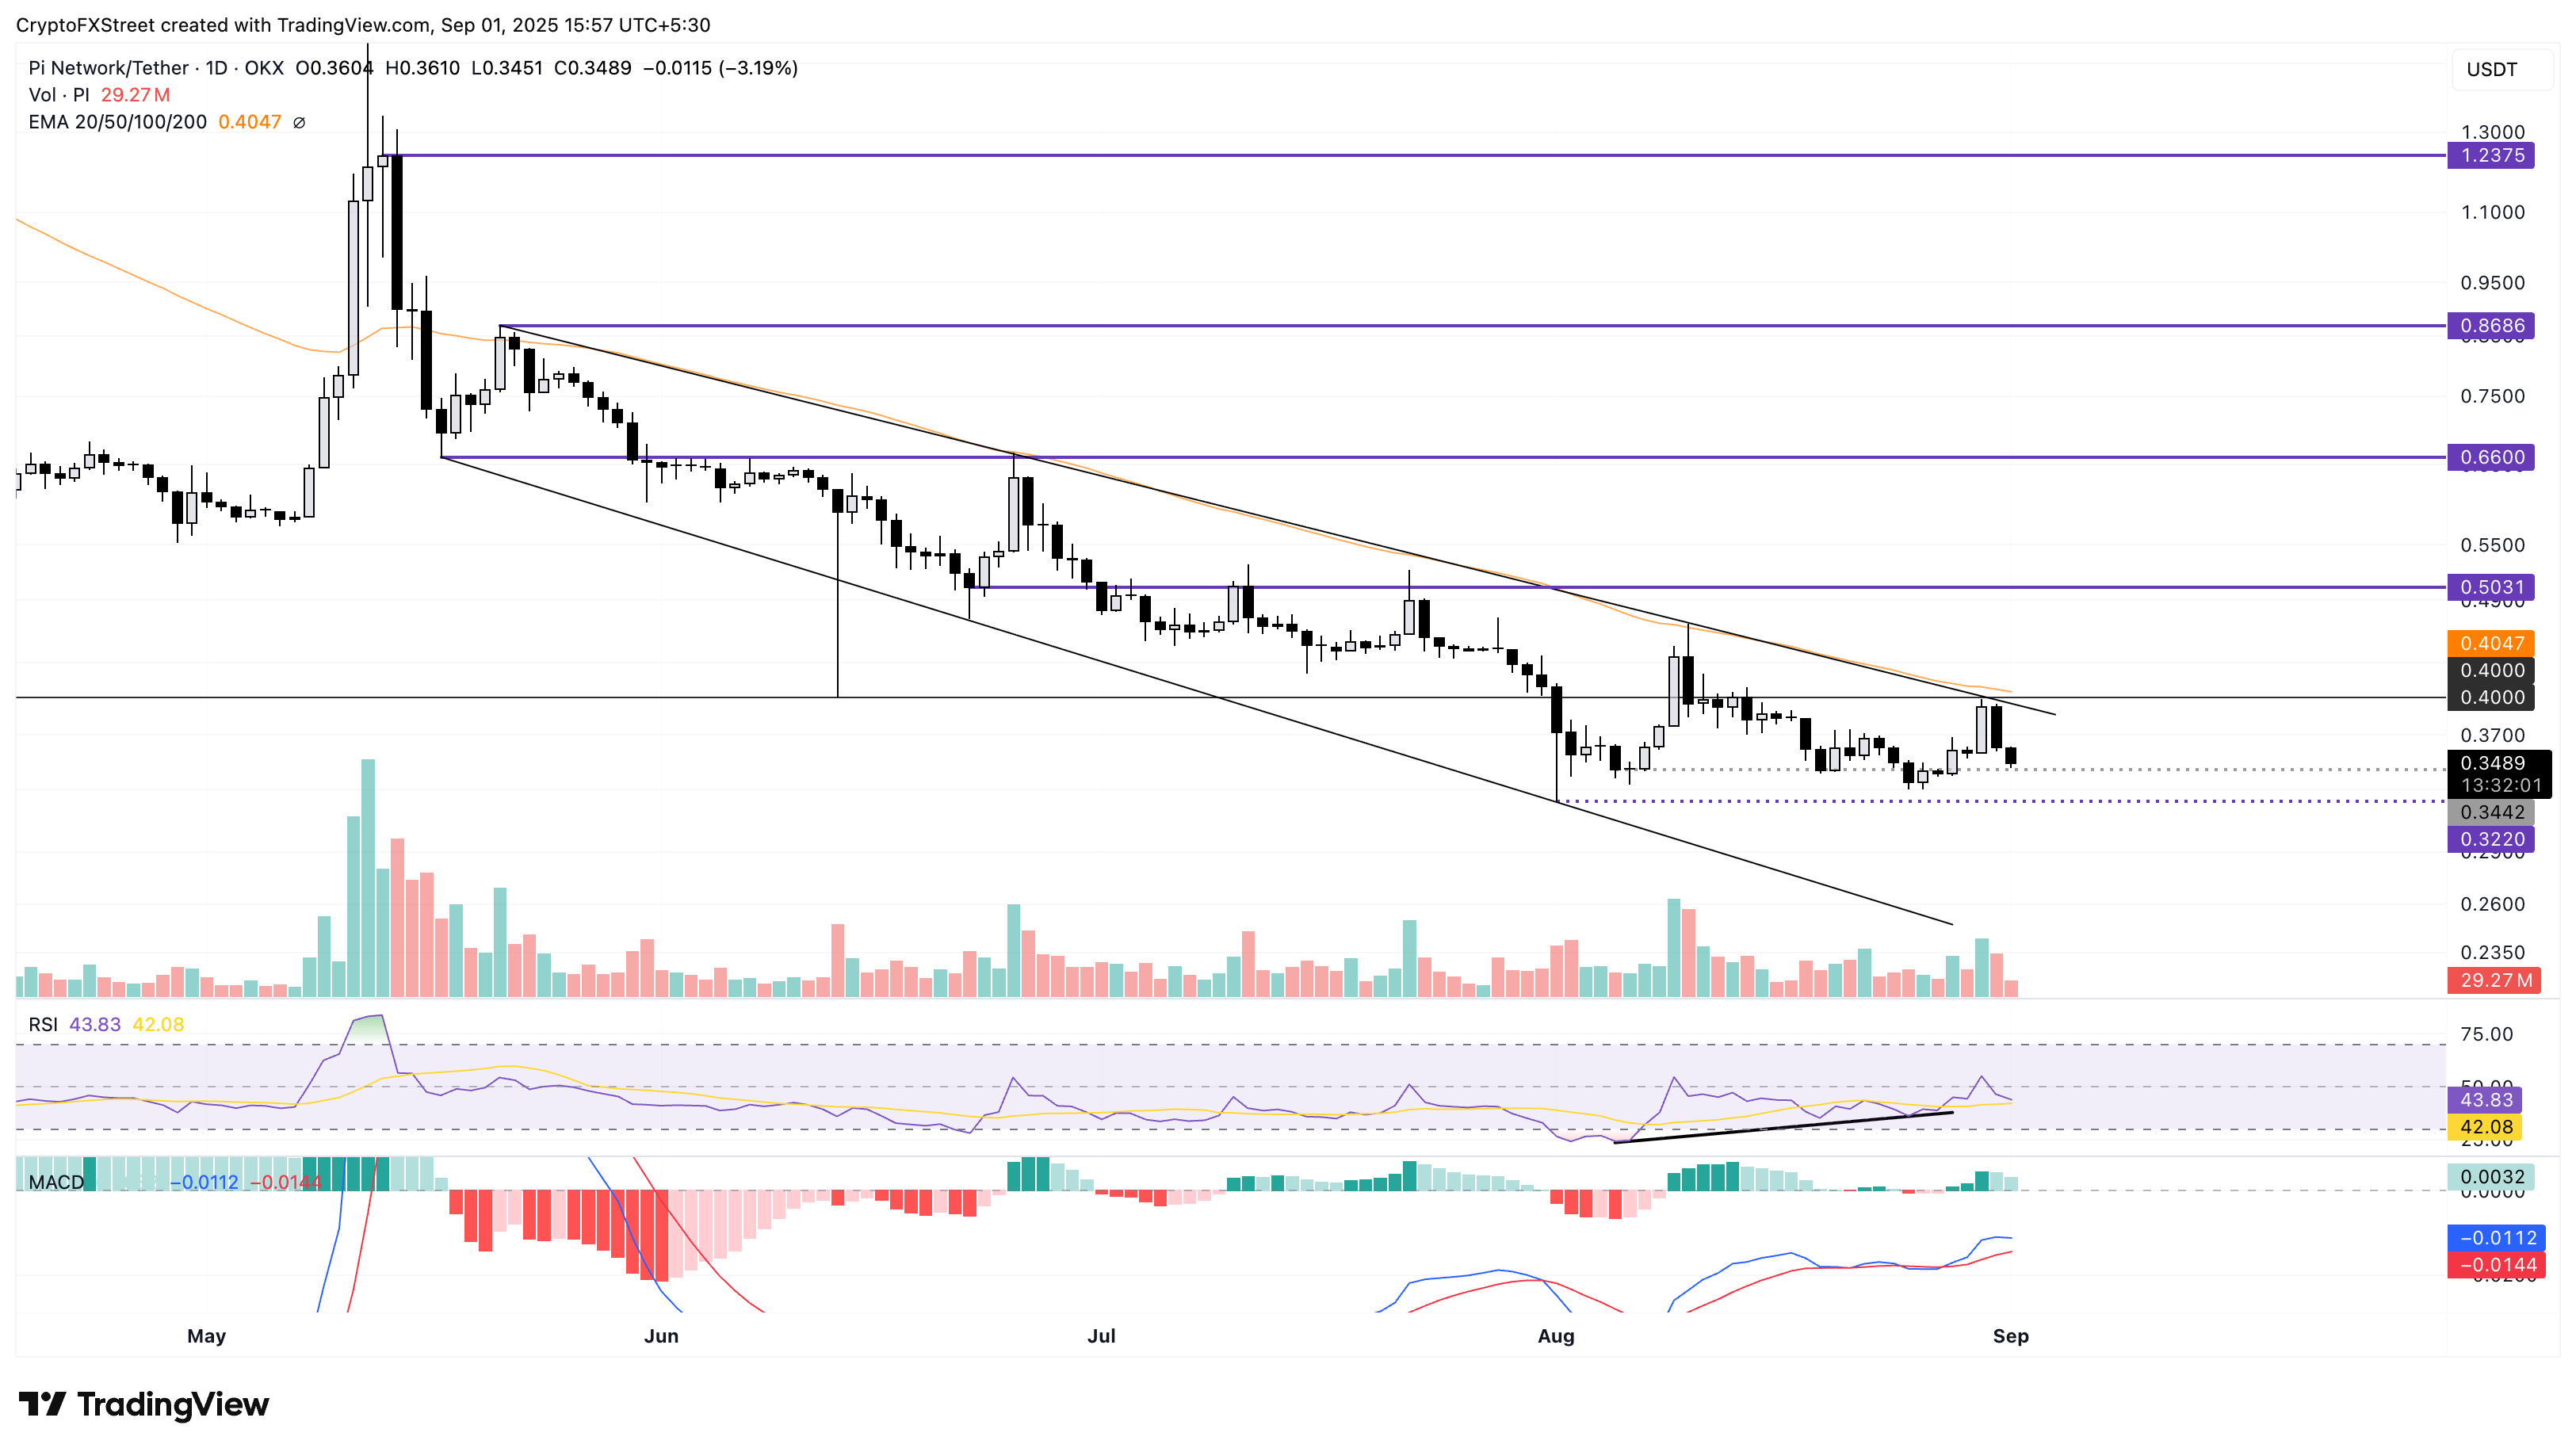
PI/USDT daily price chart.
Looking up, Pi Network should reclaim the 50-day Exponential Moving Average (EMA) at $0.4047, which is moving closely with the falling channel pattern’s overhead trendline. If so, the uptrend could target the $0.5000 psychological level.
Cryptocurrency metrics FAQs
The developer or creator of each cryptocurrency decides on the total number of tokens that can be minted or issued. Only a certain number of these assets can be minted by mining, staking or other mechanisms. This is defined by the algorithm of the underlying blockchain technology. On the other hand, circulating supply can also be decreased via actions such as burning tokens, or mistakenly sending assets to addresses of other incompatible blockchains.
Market capitalization is the result of multiplying the circulating supply of a certain asset by the asset’s current market value.
Trading volume refers to the total number of tokens for a specific asset that has been transacted or exchanged between buyers and sellers within set trading hours, for example, 24 hours. It is used to gauge market sentiment, this metric combines all volumes on centralized exchanges and decentralized exchanges. Increasing trading volume often denotes the demand for a certain asset as more people are buying and selling the cryptocurrency.
Funding rates are a concept designed to encourage traders to take positions and ensure perpetual contract prices match spot markets. It defines a mechanism by exchanges to ensure that future prices and index prices periodic payments regularly converge. When the funding rate is positive, the price of the perpetual contract is higher than the mark price. This means traders who are bullish and have opened long positions pay traders who are in short positions. On the other hand, a negative funding rate means perpetual prices are below the mark price, and hence traders with short positions pay traders who have opened long positions.
Author

Vishal Dixit
FXStreet
Vishal Dixit holds a B.Sc. in Chemistry from Wilson College but found his true calling in the world of crypto.


