PEPE whales likely catching a falling knife as they buy 2 trillion tokens in recent pullback
- PEPE price has lost more than 50% of its value after hitting an all-time high of $0.00000431 on May 5.
- Three large wallet investors bought the meme coin after the recent price pullback, accumulating 2 trillion PEPE coins.
- PEPE has been trading sideways since its decline, below $0.00000211.

PEPE, a meme coin inspired by “Pepe the frog” meme, saw an increase in its popularity after its price rose by a whopping 1,000% in ten days, reaching an all-time high of $0.00000431 on May 5. However, the asset’s price has declined more than 50% since then.
Also read: Bitcoin price recovery to $30,000 likely with dwindling BTC supply on exchanges
PEPE whales accumulate 2 trillion coins during recent correction
Despite recent price declines, large wallet addresses holding PEPE, popularly known as whales, have scooped up 2 trillion coins after the correction. PEPE price nosedived 55% from its peak and trades at $0.00000192 at the time of writing, according to data from CoinGecko.
Based on on-chain data from crypto intelligence tracker Lookonchain, three large wallet addresses started buying the meme coin after the price decline.
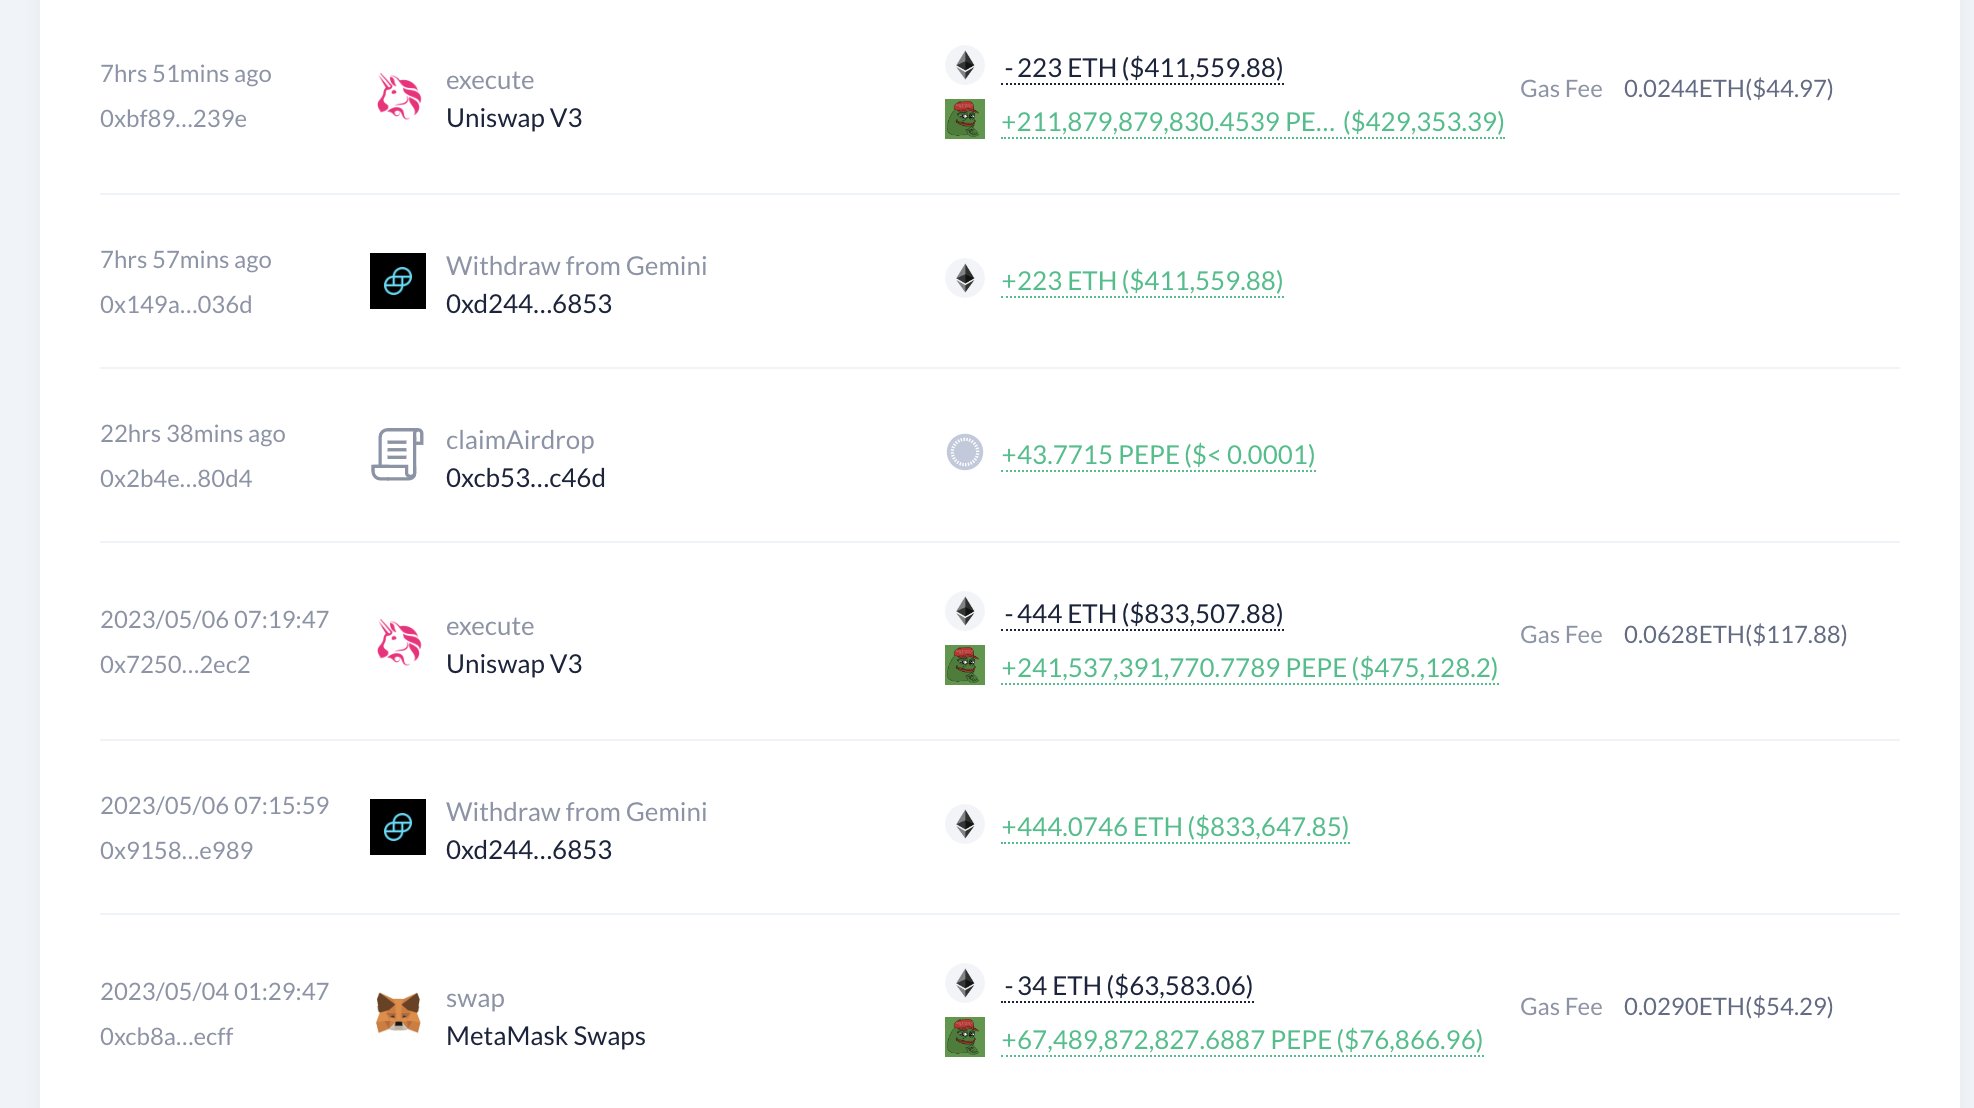
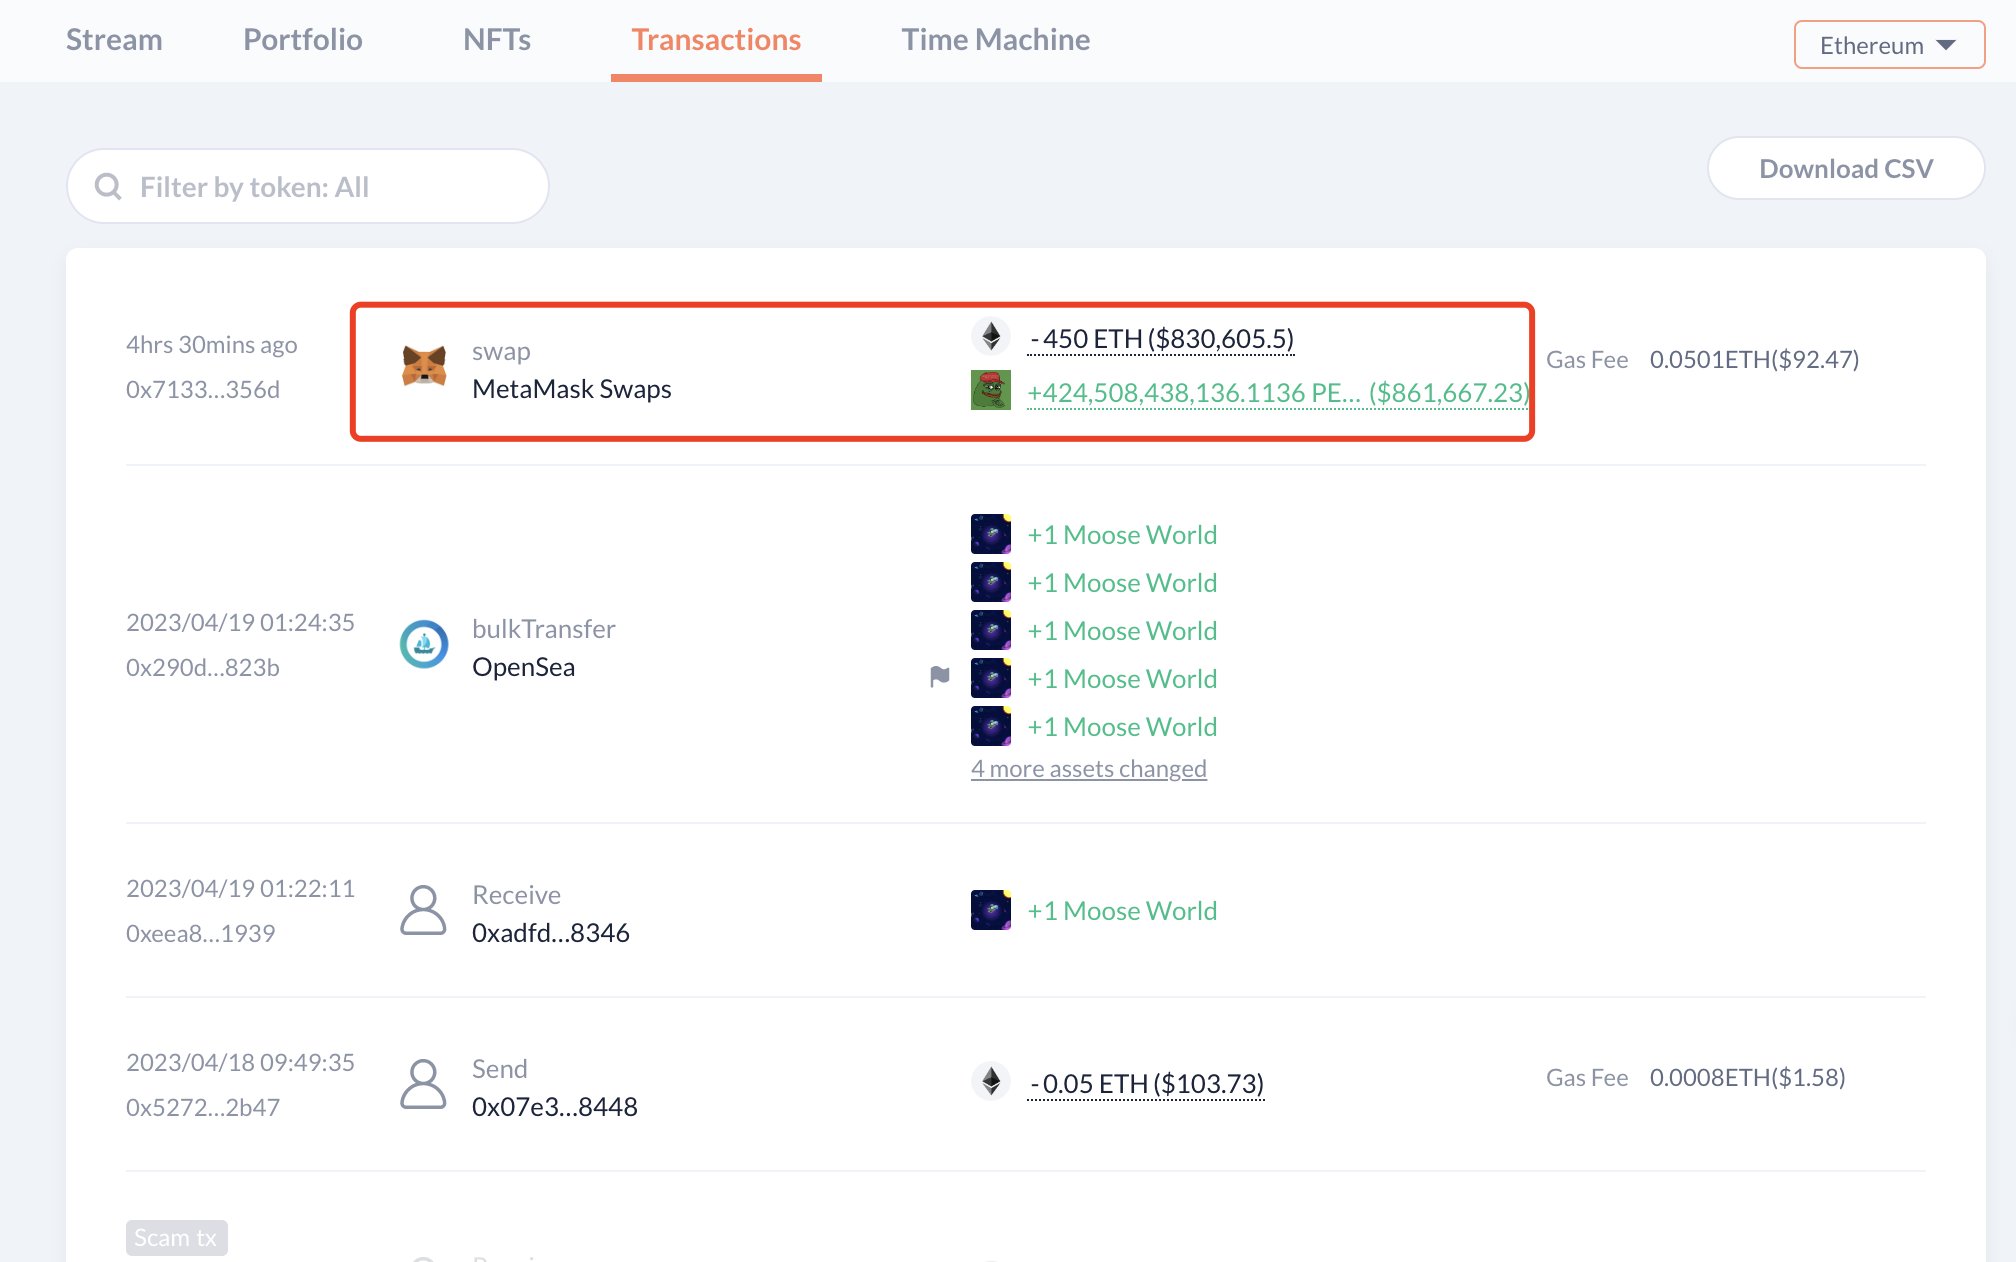
The first address (0x50C1) scooped up 1.4 trillion PEPE, worth $2.76 million on Binance at an average price of $0.000002054. The second (0x2Baa) bought 212 billion PEPE, worth $429,000 in exchange for 223 Ether at a price of $0.000001942, while the third (0x3AE8) bought 424 billion PEPE for 450 ETH at $0.000001957.
Transactions by PEPE whales
Whales are accumulating the frog-meme-inspired coin as they are likely anticipating a recovery in its price. However, the steep decline in the market capitalization of PEPE, from $1 billion to $840.88 million, signals that the asset’s recovery to its May 5 peak of $0.00000431 is unlikely.
What can whales expect if PEPE price declines?
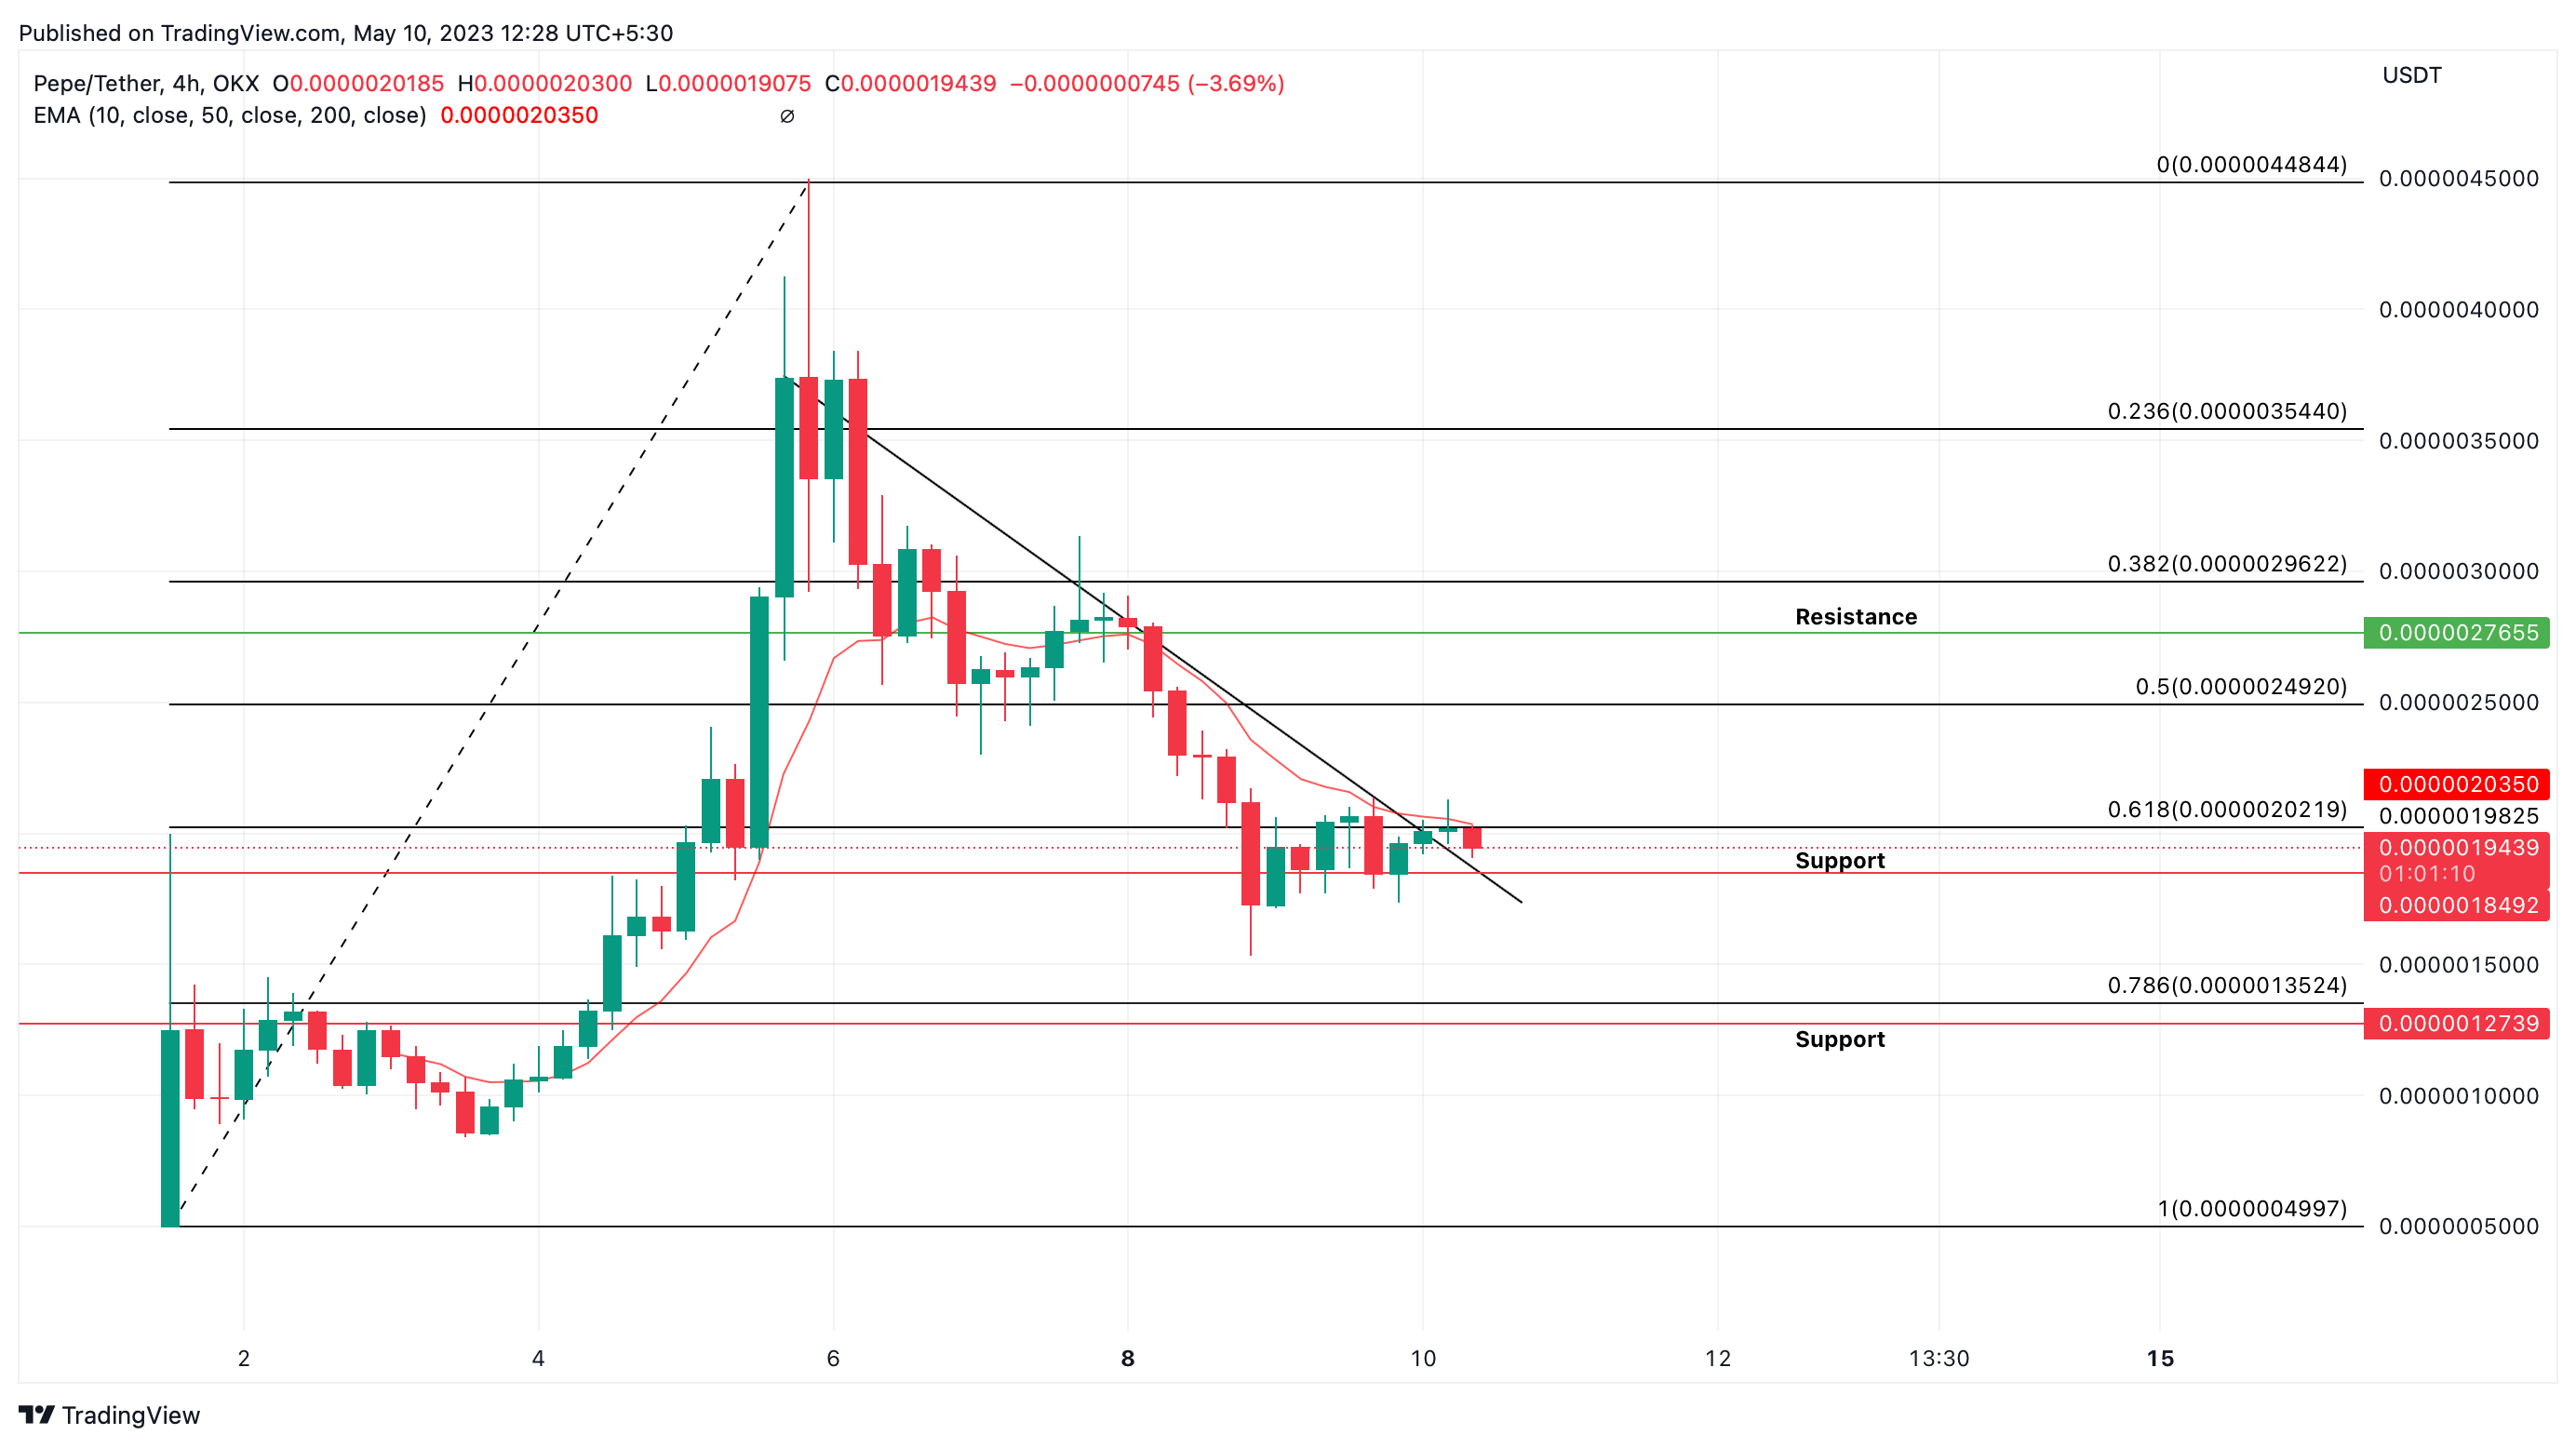
Large wallet investors attempting to catch the falling knife could face unrealized losses in the event of further declines in PEPE price. As seen in the PEPE/USDT four-hour price chart below, the asset is currently on a downward trend, setting lower highs and lower lows.
PEPE price is tackling resistance at the 10-day Exponential Moving Average of $0.00000203. The frog-inspired meme coin tackles resistance at $0.00000276, and consecutive Fibonacci levels of 38.2% and 23.6% at $0.00000296 and $0.00000354,respectively. Further up, the peak on May 5 is at $0.00000448, according to the chart.
In the event of a decline, PEPE could first fall to $0.00000194, a level that has acted as support since May 5, and later to $0.00000127, a key resistance that was flipped into support between May 2 and May 4.
PEPE/USDT four-hour price chart
A decisive close above the 61.8% Fibonacci level at $0.00000202 could invalidate the bearish thesis for PEPE and signal a trend reversal in the meme coin.
Author

Ekta Mourya
FXStreet
Ekta Mourya has extensive experience in fundamental and on-chain analysis, particularly focused on impact of macroeconomics and central bank policies on cryptocurrencies.




