Pepe Price Forecast: PEPE finds support around a key level, eyes potential rally
- Pepe price rebounds after retesting its key level at $0.000011, hinting at further recovery ahead.
- Sideline investors looking to buy could do so within the $0.000011 to $0.000012 range.
- Derivatives data show a bullish picture as funding rates flip from negative to positive, reflecting improving trader sentiment.

Pepe (PEPE) shows signs of a potential recovery after bouncing off a key support level. The frog-themed coin price action suggests renewed buying interest within a tight accumulation zone. Meanwhile, improving sentiment in the derivatives market adds credibility to a bullish outlook, with funding rates flipping positive and technical indicators suggesting a next leg higher in the upcoming days.
Pepe’s bullish sentiment improves
Coinglass’s OI-Weighted Funding Rate data show that the number of traders betting that the price of the frog-themed meme coin will slide further is lower than that anticipating a price increase.
The metric reads 0.0104% on Monday after flipping from negative to positive on Friday, indicating improved sentiment among traders as longs pay shorts. Historically, as shown in the chart below, when the funding rates have flipped from negative to positive, Pepe’s price has rallied sharply, as seen on July 7.
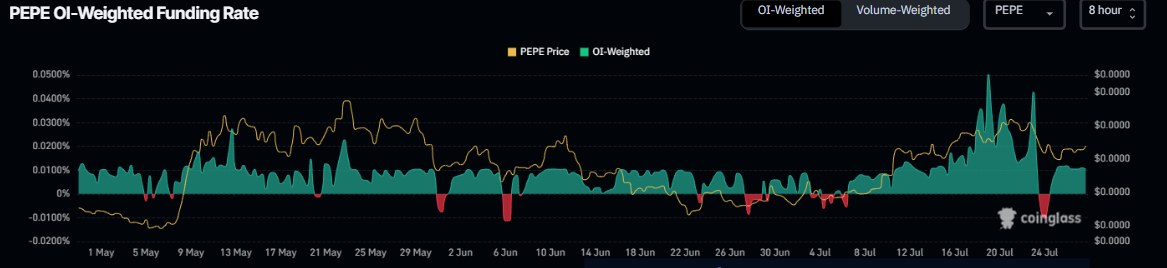
Pepe funding rate chart. Source: Coinglass
Pepe Price Forecast: PEPE retest key support zone
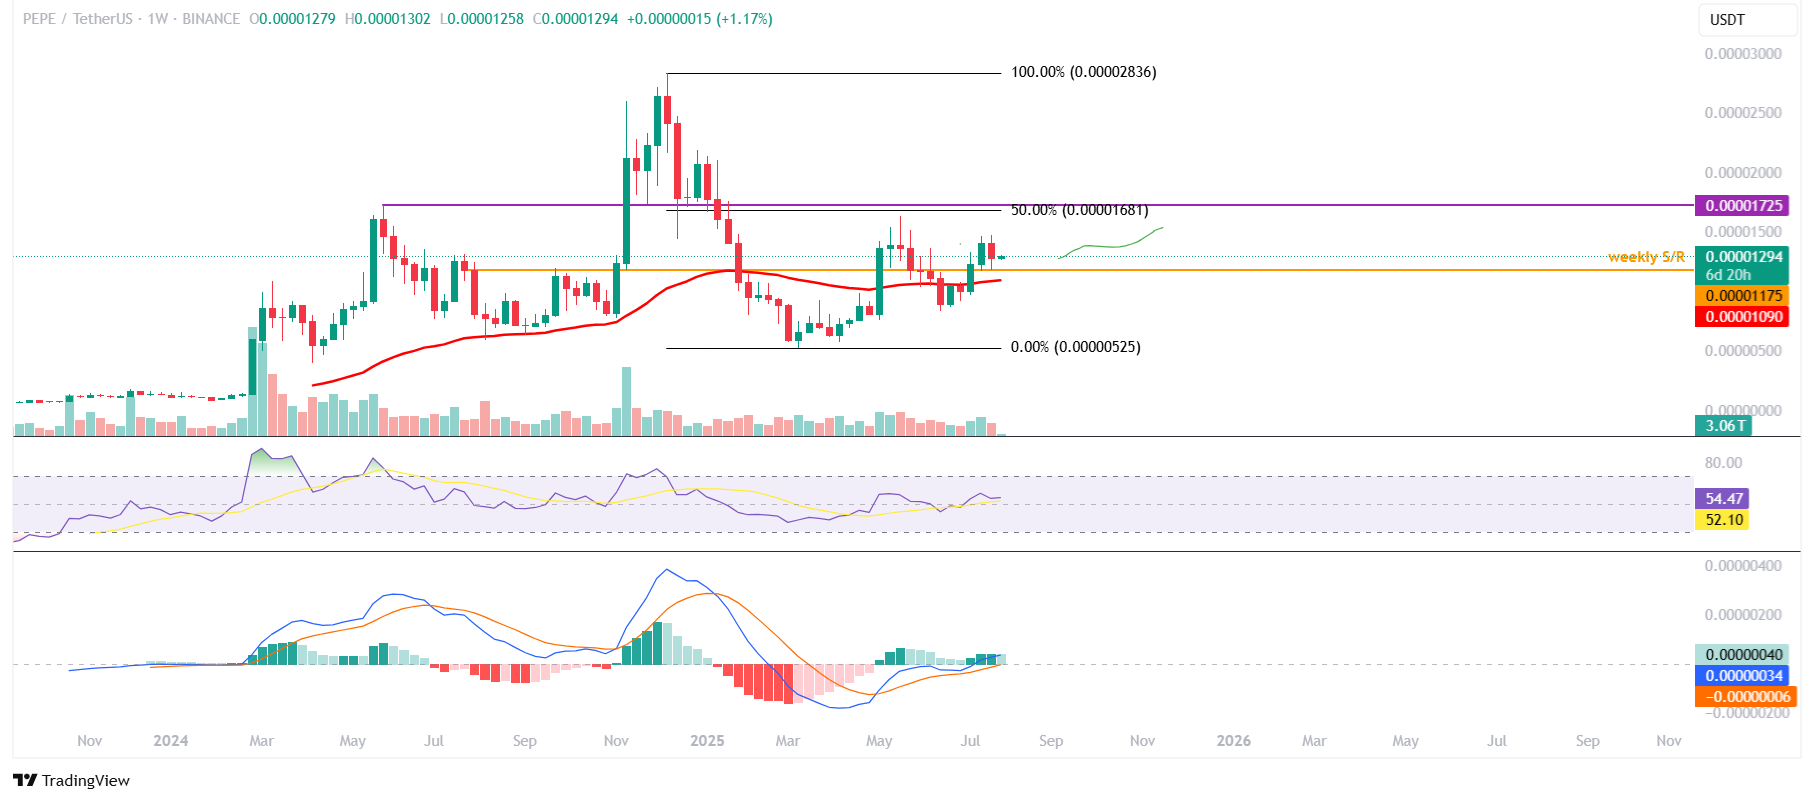
Pepe price on the weekly chart shows that it has retested and found support around the weekly support level of $0.000011 last week. At the start of this week, on Monday, it trades slightly higher at $0.000012.
If the weekly level at $0.000011 remains strong, PEPE could extend the rally to retest the 50% Fibonacci retracement level (drawn from the December high of $0.000028 to the March low of $0.000005) at $0.000016, nearly 30% higher than current levels.
The Relative Strength Index (RSI) indicator on the weekly chart reads 54, hovering just above its neutral level of 50, indicating indecisiveness among traders. For the bullish momentum to be sustained, the RSI must move above its current levels. The Moving Average Convergence Divergence (MACD) on the weekly chart shows a bullish crossover in early May. It also shows rising green histogram bars above its neutral zero line, suggesting bullish momentum gaining traction and continuing an upward trend.
PEPE/USDT daily chart
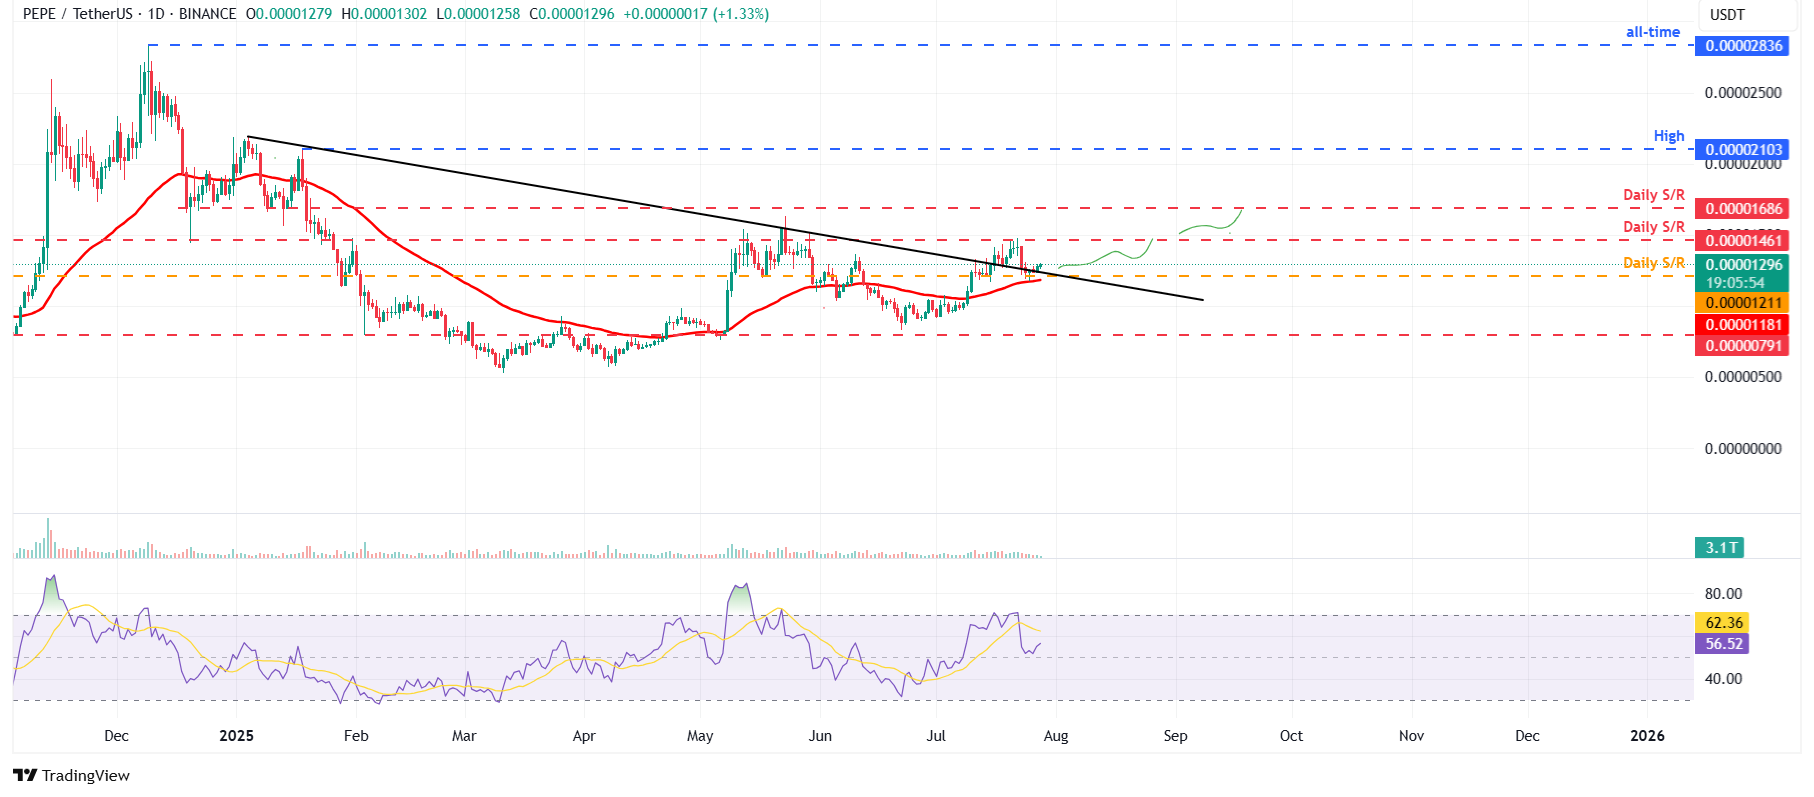
On the daily chart, the frog-based meme token faced rejection from its daily level at $0.000014 on Tuesday and declined 13% in the next two days. However, it rebounded after testing its 50-day Exponential Moving Average (EMA) at $0.000011 on Friday and recovered slightly during the weekend. This 50-day EMA roughly coincides with the previous broken descending trendline, making this a key support zone. At the time of writing on Monday, it trades at around $0.000012.
Sideline investors looking to accumulate PEPE could do so within the $0.000011 to $0.000012 range.
If PEPE continues to recover, it could extend the recovery toward its daily resistance at $0.000014. A successful close above this level could extend additional gains toward its next daily resistance at $0.000016, which coincides with the weekly target as mentioned above.
The RSI on the daily chart reads 56, having bounced off the neutral level of 50 during the weekend, and points upward, indicating that bullish momentum is gaining traction.
PEPE/USDT daily chart
Based on IntoTheBlock’s Global In/Out of the Money (GIOM), nearly 34,690 addresses accumulated 80.19 trillion PEPE tokens at an average price of $0.000011. These addresses purchased the frog-based meme token between $0.000011 and $0.000012, which marks it as a key support zone.
Interestingly, from a technical analysis perspective, the $0.000011 level, as mentioned, coincides with the GIOM findings, making this zone a key reversal area to watch.
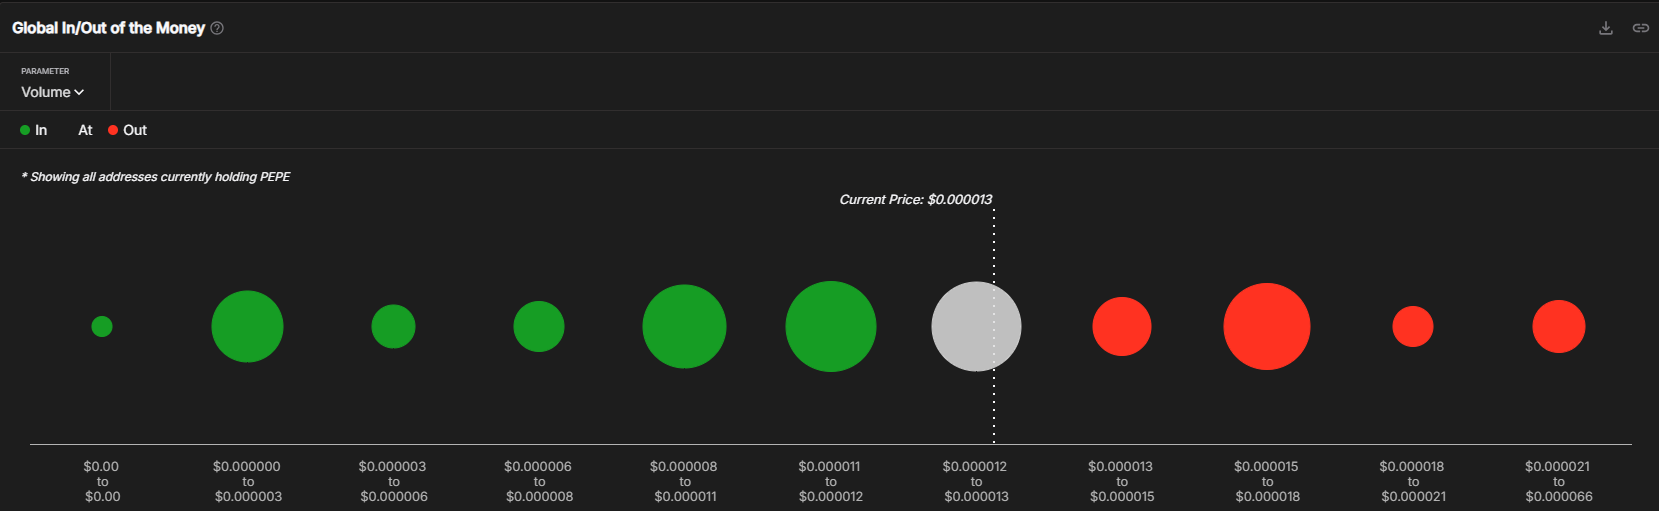
PEPE Global In/Out of the Money chart. Source: IntoTheBlock
Author

Manish Chhetri
FXStreet
Manish Chhetri is a crypto specialist with over four years of experience in the cryptocurrency industry.


