Optimism price could rally 50% as network upgrade inspires new wave of OP adoption
- Optimism price has found steady support after a 55% downtrend from the April highs.
- The mood change came after upgrading the network, delivering low fees, more security, and resilience.
- OP could rally 50% on the back of this upgrade as a new wave of buyers comes into play.

Optimism (OP) price appears to have found support after a new buyer congestion zone came into effect to prevent the free fall. Accordingly, the Ethereum Layer 2 (L2) token is trading horizontally, giving bulls time to accumulate OP at affordable rates.
Also Read: Optimism price could shoot up by 30% after OP whales accumulation spree
Optimism price shows growing buyer participation
Optimism (OP) price is down 55% since the intra-day high recorded on April 15. However, the dip could have extended if the support at $1.274 never come into play. This came after the Optimism mainnet upgrade that saw the Bedrock go live. With it, network users will enjoy low transaction fees, a more resilient network, and increased security.
The Bedrock upgrade will bring a 47% reduction in protocol costs and security fees to Optimism Mainnet
— OP Labs (@OPLabsPBC) March 2, 2023
Engineer extraordinaire @trianglesphere explains how in the latest dev blog post https://t.co/MvcG04shEB
As developers committed, the Bedrock upgrade has revolutionized the cryptocurrency's underlying technology, addressing scalability concerns and enhance the overall performance of the OP network. This positions it as a formidable contender in the highly competitive cryptocurrency landscape, particularly among L2s.
The mainnet upgrade seems to have inspired a new wave of adoption, suggested by the Relative Strength Index (RSI) showing a rising momentum by deflecting from the downtrend. At the time of writing, the L2 token is recording a 10% rise on the day despite the broader market uncertainty. If the buying pressure is sustained, Optimism price could forge higher to tag the 50-day Simple Moving Average (SMA) at around $1.798.
Further north, Optimism price could tag the 100-day SMA at $1.890 before a foray above the psychological $2.000 zone. In a highly bullish case, the Ethereum Layer 2 token could tag the 200-day SMA at $2.099, denoting a 50% climb from the current position.
Besides the RSI tipping north, the Awesome Oscillators (AO) histograms were also soaked in green and moving toward the positive zone to show buyers were steadily taking over.
Additionally, the Parabolic SAR added credence to the bulls after it flipped below the price on June 6, the same day of the upgrade. Whenever this trend-following indicator follows an asset from the bottom, it suggests the bulls are leading.
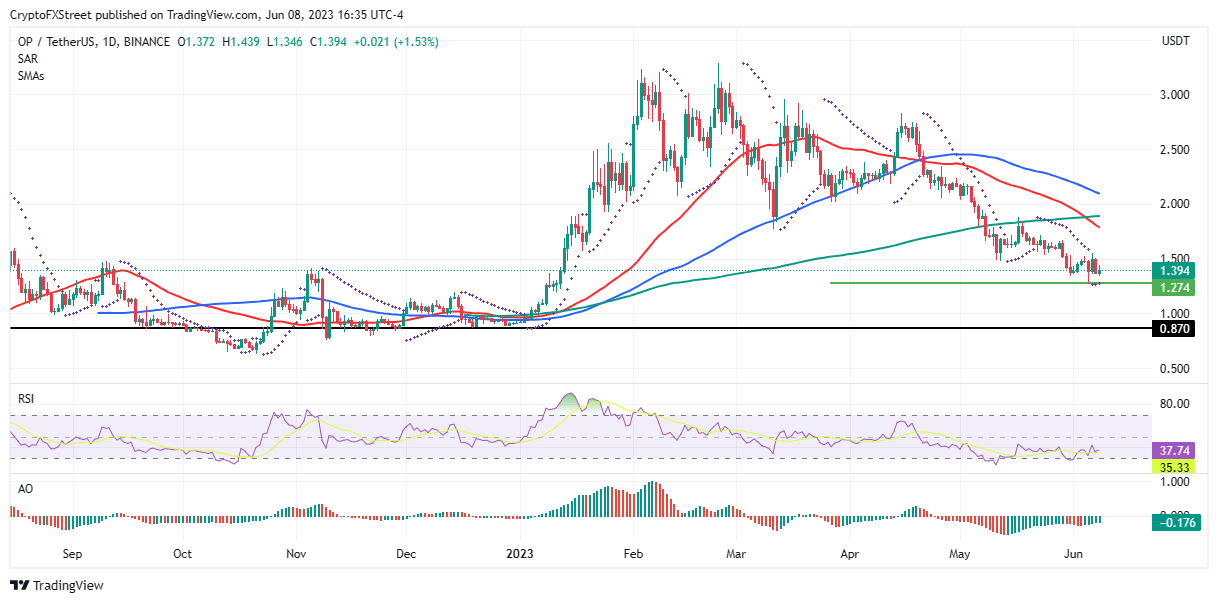
OP/USDT 1-Day Chart
On-chain metrics favor the upside
On-chain metrics from IntoTheBlock’s Global In/Out of the Money (GIOM) show robust support downward for the Layer 2 token, which favors the upside.
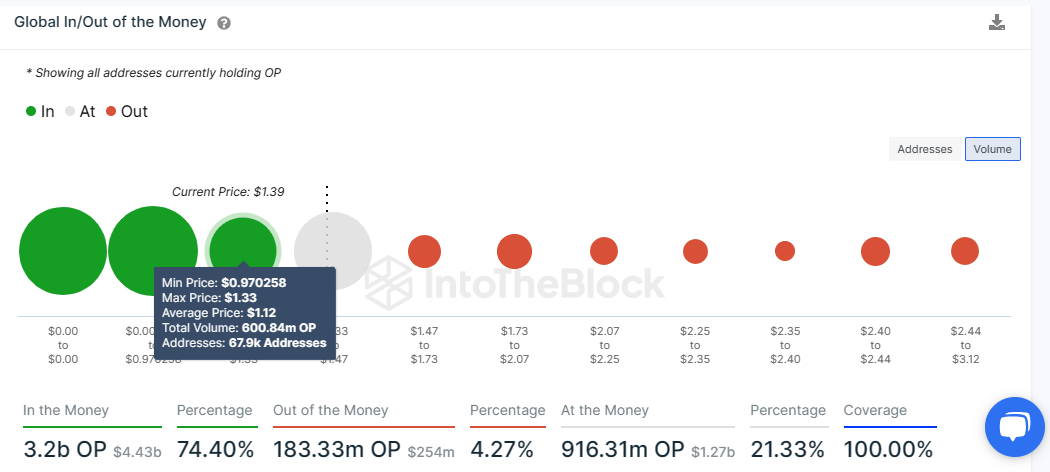
Based on the GIOM chart above, Optimism price has stronger support downward compared to overhead pressure. As such, any efforts to push OP downward below the current price of $1.394 would be countered by a strong buyer presence, where approximately 67,900 addresses bought 600.84 million OP tokens at an average price of $1.120.
On the flip side, if profit-taking intensifies to overpower the bulls, Optimism price could fall below the immediate support at $1.274 to tag the $0.870 support floor.
Author

Lockridge Okoth
FXStreet
Lockridge is a believer in the transformative power of crypto and the blockchain industry.


