OmiseGO Price Prediction: OMG faces strong resistance barriers, bears aim to go below $3
- OmiseGO's hourly chart has flashed a sell signal in the hourly chart.
- OMG whales have been busy buying the dip.

After reaching a high of $4.11 on September 29, OmiseGO has dropped drastically to $2.77 on November 4. Since then, the price has found healthy support and managed to bounce up. However, several technicals have turned bearish, which doesn’t bode well for the payments platform.
Is OMG going down?
While the price did bounce up on November 5, OMG has faced massive resistance at the 50-day SMA ($3.34). The buyers are looking to take on the 50-day SMA again after finding support at the $3.08 support wall. However, several signs show us that this movement is probably going to get thwarted again.
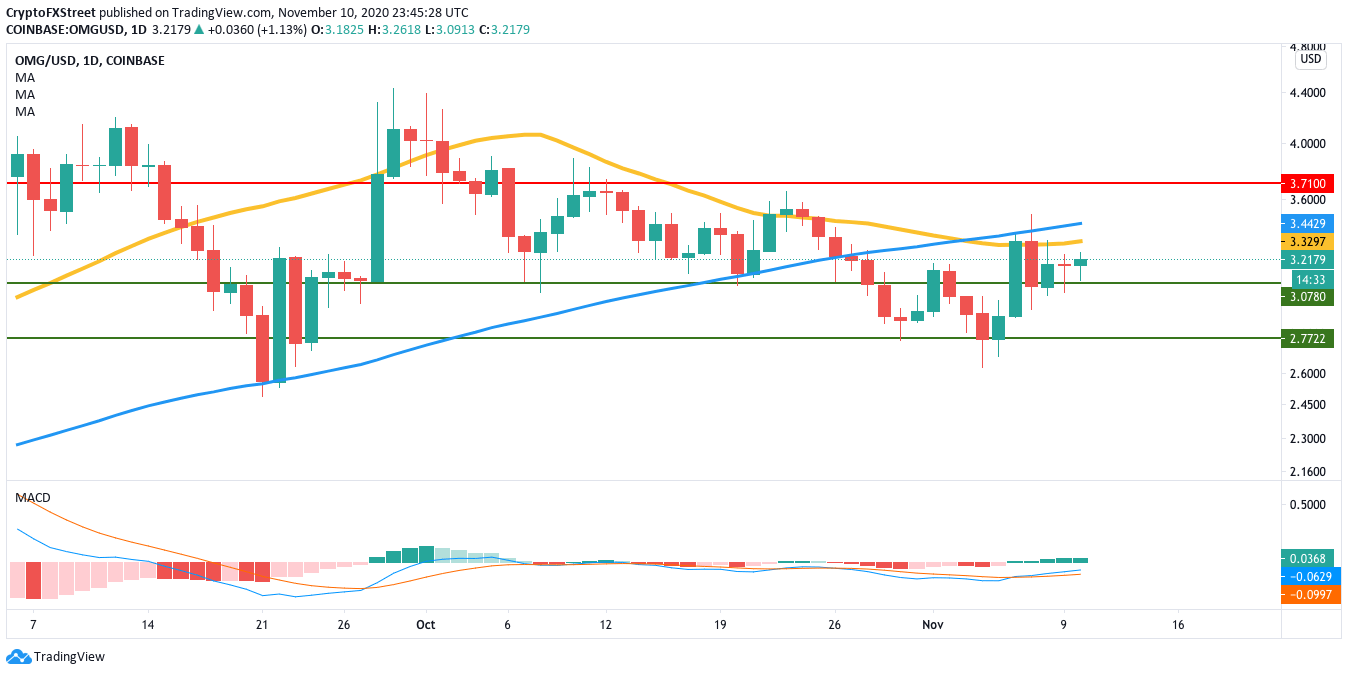
OMG/USD daily chart
IntoTheBlock’s In/Out of the Money Around Price (IOMAP) helps us visualize strong support and resistance levels. As per the tool, there are two substantial resistance barriers at the 50-day SMA ($3.34) and 100-day SMA ($3.45). Breaking above these barriers seems pretty tough as of now. The downside is capped off at $3.07, which had previously managed to keep the price up.
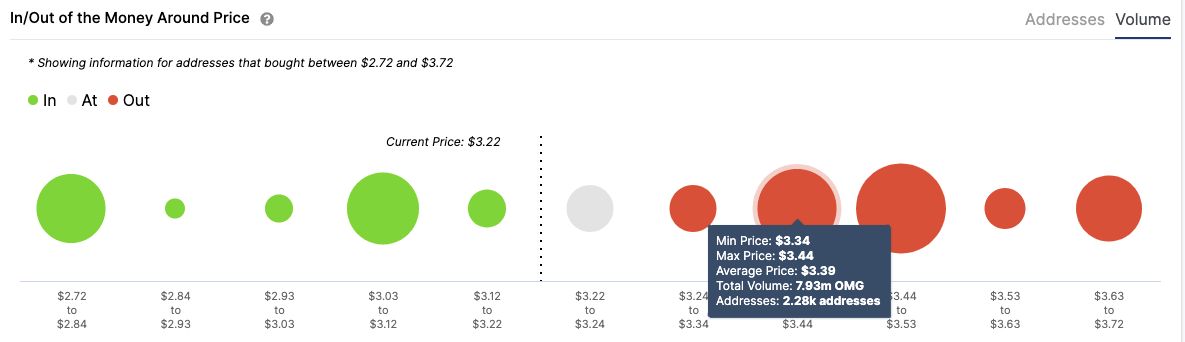
OMG IOMAP
Adding further credence to the bearish outlook is the hourly chart, which has flashed the sell signal with a green-nine candlestick in the TD sequential indicator. The last time the hourly chart flashed the sell signal, OMG fell from $3.42 to $3.30 in just five sessions. The downside is capped off by the $3.29 support wall and the 100-bar SMA ($3.19).
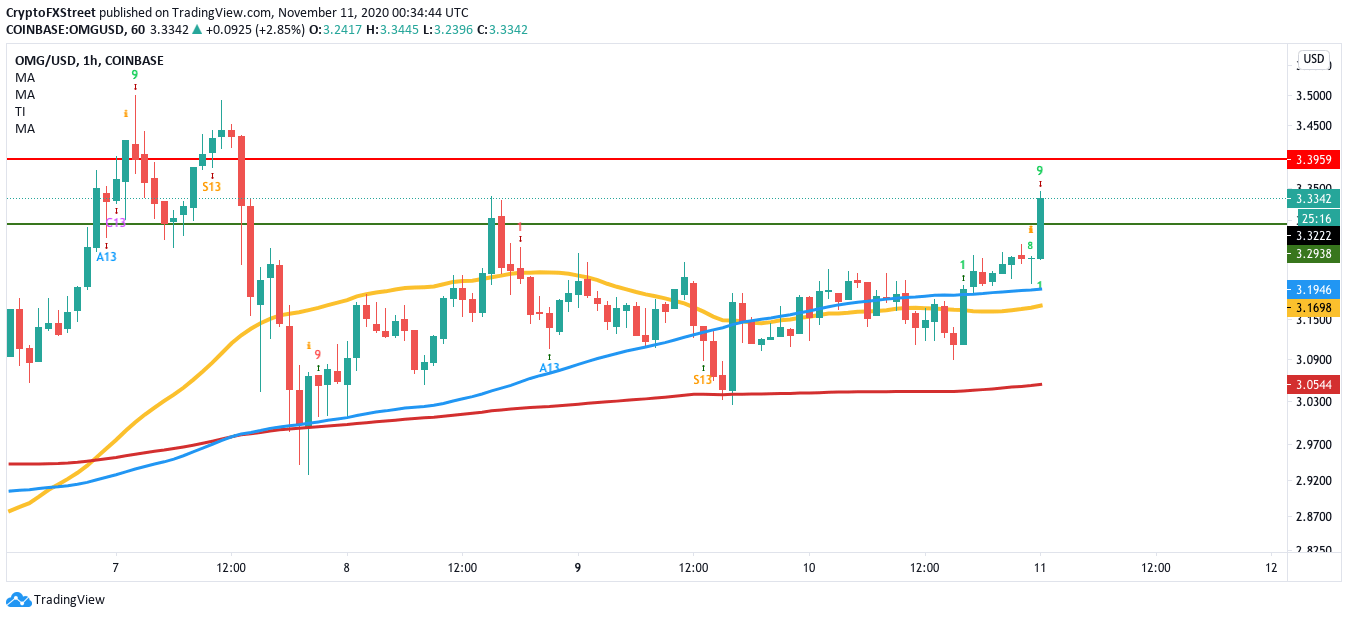
OMG/USD hourly chart
However, it’s not all doom and gloom for the network. Santiment’s "holders distribution" chart shows us that the whales have been on a buying spree. The number of addresses holding 100,000-1,000,000 tokens went up from 70 to 75 between October 8 and October 11. Similarly, the number of addresses holding 1,000,000 to 10,000,000 tokens rose from 19 to 20 over the last 24 hours.
 [05.17.07, 11 Nov, 2020]-637406527582918458.png)
OMG holders distribution
To conclude, multiple technicals have turned bearish for OMG, so a downward movement is expected. The $3.07 support wall has previously managed to keep the price up. However, if the bears manage to break below it, the next strong support lies at $2.77. Meanwhile, the whales are busy buying the dip, so it’s not all bad news for the plasma platform.
Author

Rajarshi Mitra
Independent Analyst
Rajarshi entered the blockchain space in 2016. He is a blockchain researcher who has worked for Blockgeeks and has done research work for several ICOs. He gets regularly invited to give talks on the blockchain technology and cryptocurrencies.


