NEO/USD Technical Analysis: Bears claw back into the market

NEO/USD Daily Chart
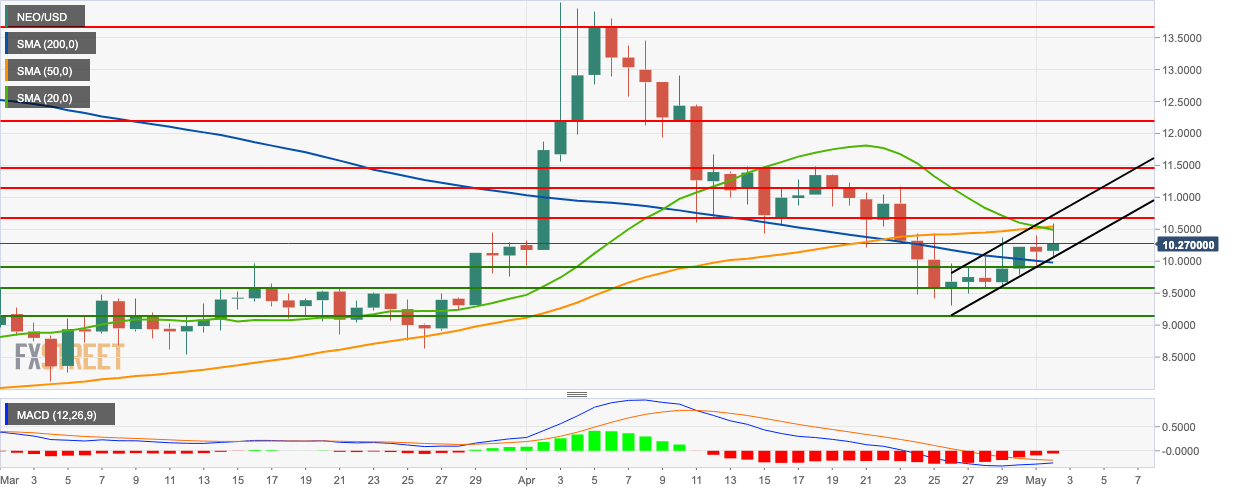
- NEO/USD went up from $10.16 to $10.27 this Thursday.
- The price is currently trending upwards in a channel formation.
- The price is above the SMA 200 curve while still below the SMA 20 and SMA 50 curves.
- The SMA 50 curve has crossed above the SMA 20 curve, which is a bearish sign.
- The signal line is about to converge with the MACD line, showing decreasing bearish momentum.
NEO/USD 4-Hour Chart
-636924364528932763.png)
- The relative strength index (RSI) indicator is trending at 56.25.
- The 4-hour NEO/USD market forms a triangle formation from which the price has had a bearish breakout.
- The market is above the SMA 50 and SMA 20 curves.
- The 4-hour price is trending in a downward channel.
NEO/USD Hourly Chart
-636924364110026549.png)
- The hourly NEO/USD is trending below the SMA 20 curve.
- The hourly price is above the SMA 200 and SMA 50 curves.
- The Elliot oscillator shows seven consecutive bearish sessions.
- The short-term resistance lies at $10.30.
Key Levels
Author

Rajarshi Mitra
Independent Analyst
Rajarshi entered the blockchain space in 2016. He is a blockchain researcher who has worked for Blockgeeks and has done research work for several ICOs. He gets regularly invited to give talks on the blockchain technology and cryptocurrencies.
More from Rajarshi Mitra


