NEO/USD Elliott Wave technical analysis [Video]
![NEO/USD Elliott Wave technical analysis [Video]](https://editorial.fxsstatic.com/images/i/crypto-coins-1_XtraLarge.png)
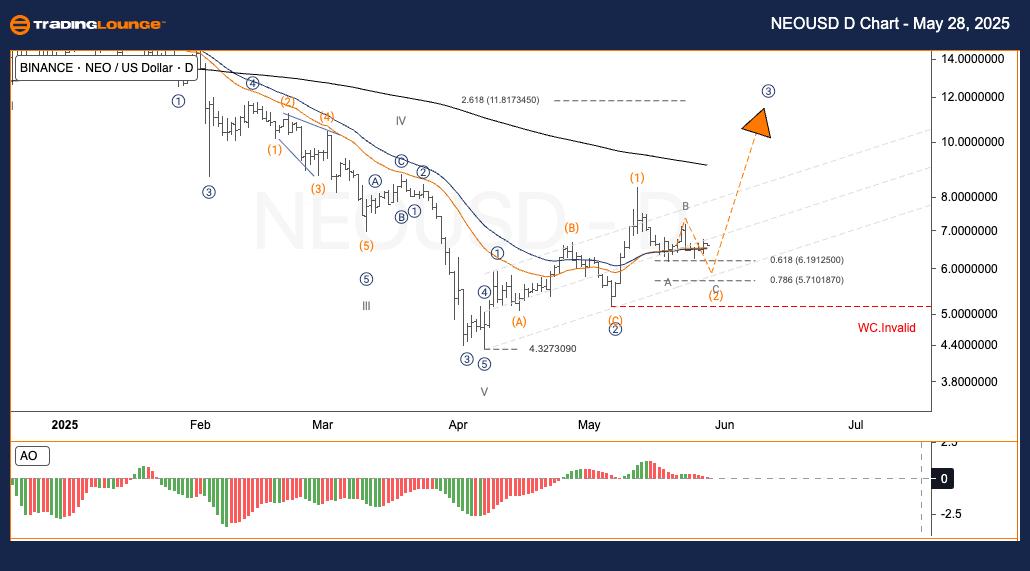
NEO/USD Elliott Wave technical analysis
-
Function: Follow Trend.
-
Mode: Motive.
-
Structure: Impulse.
-
Current position: Wave ((3)).
-
Next higher direction: Awaiting.
-
Invalidation level: Not specified.
NEO/USD trading strategy
NEO appears to present a buying opportunity during the wave (2) pullback. A significant upward move is expected in wave ③. As long as the price holds above the key Fibonacci retracement area and remains above $5, this setup could serve as a valuable entry point for Elliott Wave followers.
Trading strategies
- Strategy overview:
- Short-term traders (swing trade)
-
Monitor for a price reversal near the $6.2–$5.7 range, which is considered a low-risk buying zone.
- Risk management:
- Place a Stop Loss just under $5.00 to control downside exposure.
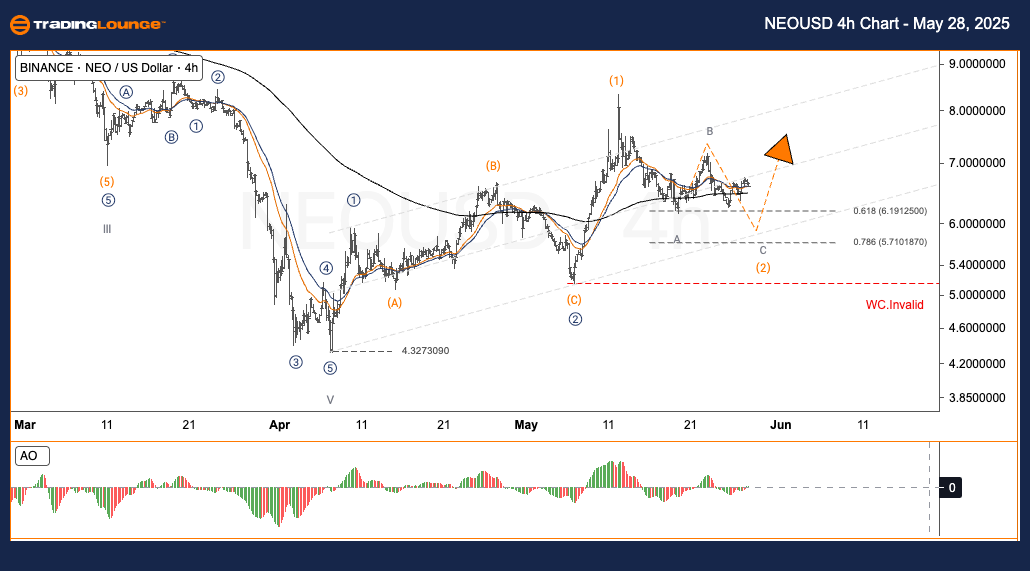
NEO/USD Elliott Wave technical analysis
-
Function: Follow Trend.
-
Mode: Motive.
-
Structure: Impulse.
-
Current position: Wave ((3)).
-
Next higher direction: Awaiting.
-
Invalidation level: Not specified.
NEO/USD trading strategy
NEO is still within a potential buy zone as part of a wave (2) correction. A notable rise is forecasted in wave ③. The critical support remains at $5, and staying above this threshold strengthens the case for a bullish move.
Trading strategies
Strategy overview:
Short-term traders (swing trade)
- Look for a reversal near the $6.2–$5.7 level for a potential entry.
Risk management:
- Use a Stop Loss just below $5.00 for protection.
NEO/USD Elliott Wave technical analysis [Video]
Author

Peter Mathers
TradingLounge
Peter Mathers started actively trading in 1982. He began his career at Hoei and Shoin, a Japanese futures trading company.


