|

Neo technical analysis: NEO/USD bulls charge towards $18

  • NEO/USD went up from $16.87 to $17.93 this Monday, charting a 6.82% increase in price.
  • The last time NEO/USD traded in this zone was in October 2018.

NEO/USD daily chart

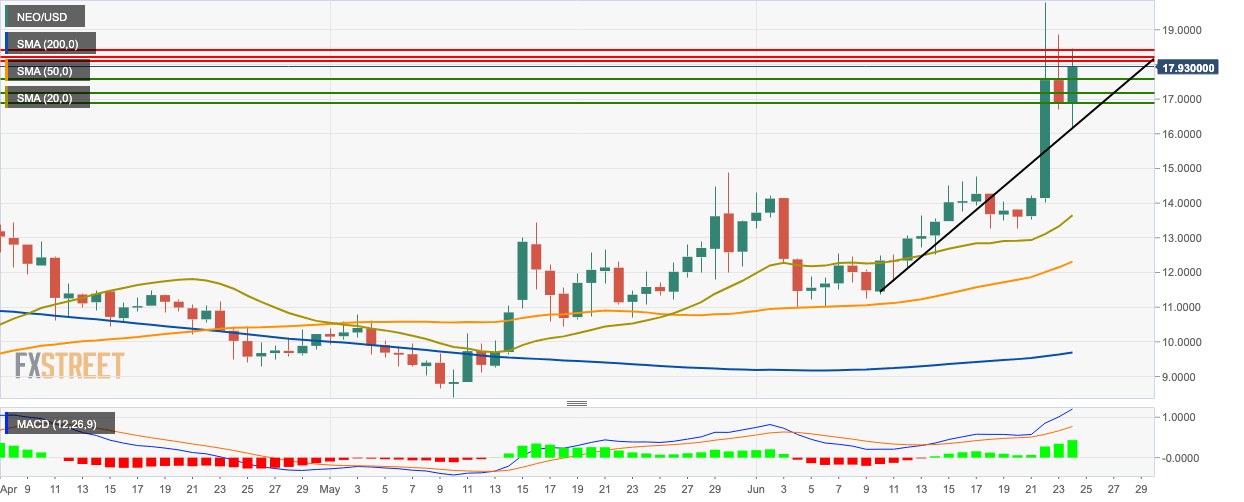
Following this Sunday’s bearish movement, the bulls roared back this Monday. Over the day, NEO/USD  went up from $16.87 to $17.93, charting a 6.82% increase in price. The bulls need to get past resistance levels at $18, $18.25 and $18.50 to keep continue with the upward movement.

The price has found support on the upwards trending line and is trending above the 200-day simple moving average (SMA 200), SMA 50 and SMA 20 curves. The moving average convergence/divergence (MACD) indicator shows that the signal line is diverging away from the MACD line, indicating higher bullish momentum.

NEO/USD 4-hour chart

The four latest sessions of the 4-hour NEO/USD chart is consolidating in a flag formation, getting primed for a breakout. The latest session broke past resistance at $17.85. The market is trending above the SMA 200, SMA 50 and SMA 20 curves and the green Ichimoku cloud. The upcoming market sentiment is bearish, as indicated by the red Ichimoku cloud. The relative strength index (RSI) indicator is trending around 68.75, right next to the overbought zone.

NEO/USD hourly chart

The hourly NEO/USD market has had a bullish breakout from the flag formation. Within the flag, the SMA 20 has crossed over the SMA 50 curve, which is a bullish sign. The market has found support on the SMA 20 and SMA 50 curves and is trending comfortably above the SMA 200 curve. The 20-day Bollinger band’s jaw has narrowed, indicating decreasing market volatility. The Elliot oscillator has had two straight bullish sessions following six consecutive bearish sessions.

Key Levels

NEO/USD

Overview
Today last price17.929
Today Daily Change1.06500
Today Daily Change %6.32
Today daily open16.864
 
Trends
Daily SMA2013.32833
Daily SMA5012.14941
Daily SMA10011.36022
Daily SMA2009.63255
Levels
Previous Daily High18.865
Previous Daily Low16.708
Previous Weekly High14.764
Previous Weekly Low13.263
Previous Monthly High14.89
Previous Monthly Low8.4098
Daily Fibonacci 38.2%17.53197
Daily Fibonacci 61.8%18.04103
Daily Pivot Point S116.093
Daily Pivot Point S215.322
Daily Pivot Point S313.936
Daily Pivot Point R118.25
Daily Pivot Point R219.636
Daily Pivot Point R320.407


Author

Rajarshi Mitra

Rajarshi Mitra

Independent Analyst

Rajarshi entered the blockchain space in 2016. He is a blockchain researcher who has worked for Blockgeeks and has done research work for several ICOs. He gets regularly invited to give talks on the blockchain technology and cryptocurrencies.

More from Rajarshi Mitra
Share:

Editor's Picks

Top 3 Price Prediction: Bitcoin, Ethereum, and Ripple face downside risk as bears regain control

Bitcoin, Ethereum, and Ripple remain under pressure on Wednesday, with the broader trend still sideways. BTC is edging below $68,000, nearing the lower consolidating boundary, while ETH and XRP also declined slightly, approaching their key supports.

Cardano Price Forecast: ADA stalls as mixed signals limit recovery

Cardano steadies at $0.28 on Wednesday after failing to break through a key resistance zone over the weekend. Mixed signals from the derivatives and on-chain metrics suggest that ADA’s short-term outlook remains uncertain, limiting the scope for a recovery.

Pi Network Price Forecast: PI rally defies market pressure ahead of its first anniversary

Pi Network is trading above $0.1900 at press time on Wednesday, extending the weekly gains by nearly 8% so far. The steady recovery is supported by a short-term pause in mainnet migration, which reduces pressure on the PI token supply for Centralized Exchanges.

Top Crypto Gainers: Jito drops, Morpho holds steady, Convex Finance climbs

Decentralized Finance (DeFi) tokens, including Jito, Morpho, and Convex Finance, rank among the top-performing crypto assets over the last 24 hours. Jito dips on Wednesday after rallying 22% the previous day on the launch of a new mainnet node.

Bitcoin Price Annual Forecast: BTC holds long-term bullish structure heading into 2026

Bitcoin (BTC) is wrapping up 2025 as one of its most eventful years, defined by unprecedented institutional participation, major regulatory developments, and extreme price volatility.

Bitcoin: BTC bears aren’t done yet

Bitcoin (BTC) price slips below $67,000 at the time of writing on Friday, remaining under pressure and extending losses of nearly 5% so far this week.