NEO (NEO/USD) Elliott Wave technical analysis [Video]
![NEO (NEO/USD) Elliott Wave technical analysis [Video]](https://editorial.fxsstatic.com/images/i/crypto-02_XtraLarge.jpg)
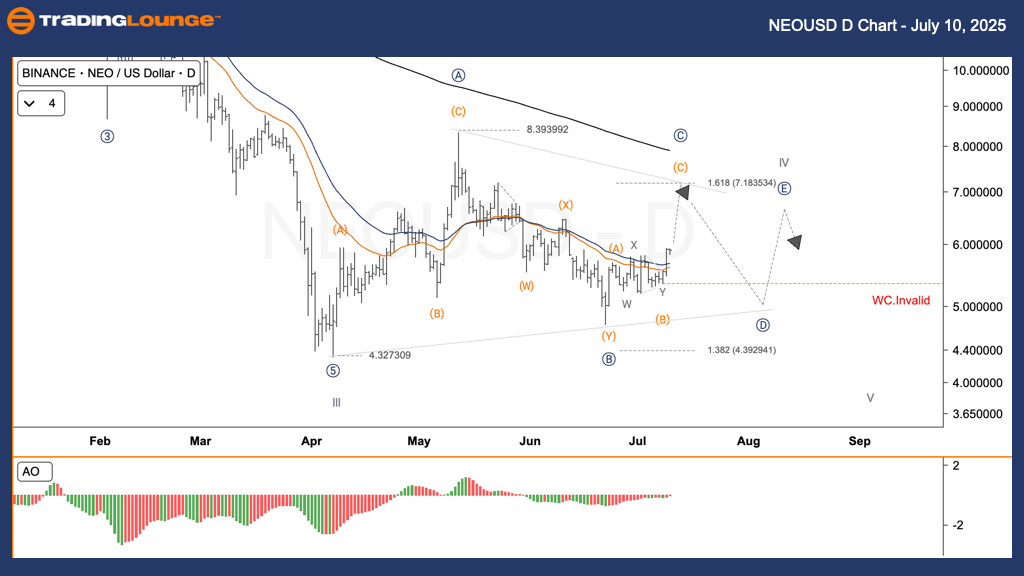
NEO/USD Elliott Wave technical analysis – Daily chart
-
Function: Counter Trend.
-
Mode: Corrective.
-
Structure: Triangle.
-
Position: Wave C.
-
Next direction (higher degrees): Pending.
-
Invalidation level: Below $5.30.
NEO/USD trading strategy
NEO has been forming a classic A-B-C-D-E triangle pattern within a larger wave IV since early 2025. The price action continues to narrow, bouncing between trend lines as bulls and bears alternate control. The latest move has touched the upper boundary of this formation, which may indicate the completion of wave E and a potential breakdown toward the final downward wave V.
Trading strategies
-
Swing trade (short-term traders):
This is a potential entry point where wave D could transition lower, aligning with the triangle’s expected behavior. -
Invalidation point:
If the price breaks below $5.30, the current wave count is no longer valid.
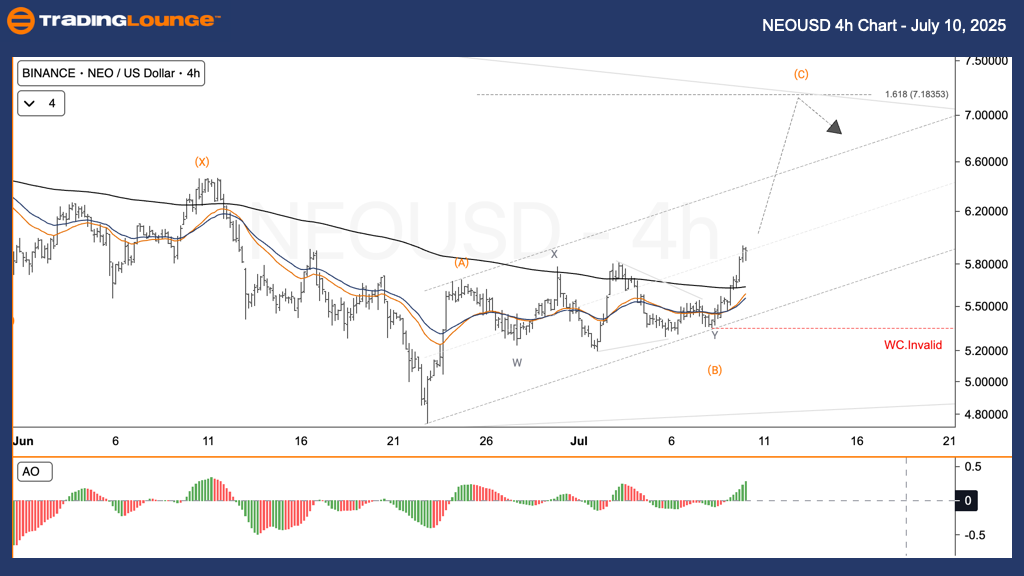
NEO/USD Elliott Wave technical analysis – Four-hour chart
-
Function: Counter Trend.
-
Mode: Corrective.
-
Structure: Triangle.
-
Position: Wave C.
-
Next direction (higher degrees): Pending.
-
Invalidation level: Below $5.30.
NEO/USD trading strategy
The 4-hour chart shows NEO steadily moving within a rising channel, aligning with a developing wave C within the triangle of a broader wave IV. This upward move in wave C appears strong and could peak around the Fibonacci 1.618 level at $7.18 before turning lower.
Trading strategies
-
Swing trade (short-term traders):
Price could soon transition from wave C to wave D, a potential short-selling opportunity per triangle expectations. -
Invalidation point:
Any decline below $5.30 will invalidate the current wave count.
NEO (NEO/USD) Elliott Wave technical analysis [Video]
Author

Peter Mathers
TradingLounge
Peter Mathers started actively trading in 1982. He began his career at Hoei and Shoin, a Japanese futures trading company.


