Monero Price Forecast: XMR extends gains, bulls target four-month highs
- Monero price extends its gains on Thursday after rallying by over 4% the previous day.
- Derivatives data support further gains as open interest and bullish bets continue to rise.
- The technical outlook suggests a continuation of the rally, with bulls aiming for the $357 mark.

Monero (XMR) is trading in green at around $333 as of Thursday's writing, having rallied more than 4% the previous day. The derivatives data further support the bullish outlook as Open Interest (OI) and bullish bets continue to rise. Meanwhile, technical analysis suggests further gains, targeting levels above $357.
Monero’s derivatives data show bullish sentiment among traders
Futures OI in Monero at exchanges rose from $39.84 million on October 1 to $58.61 million on October 5, the highest level since the end of May and currently steadies around $55.72. Rising OI represents new or additional money entering the market and new buying, which could fuel the current XMR price rally.
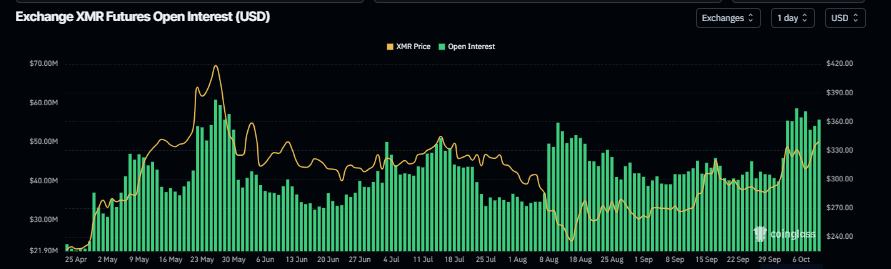
XMR open interest chart. Source: Coinglass
Coinglass’s long-to-short ratio for XMR reads 1.05, nearly its monthly high. The ratio above one suggests that more traders are betting on XMR’s price to rally.
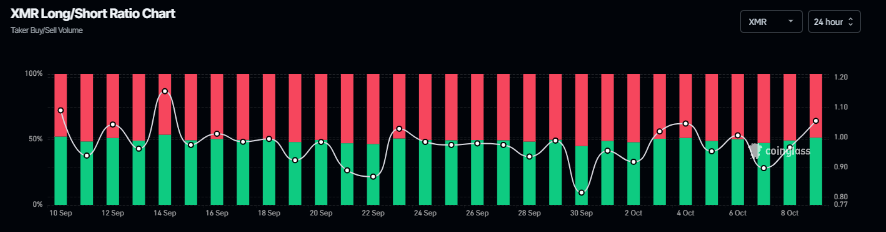
XMR long-to-short ratio chart. Source: Coinglass
CryptoQuant’s chart below shows that Monero’s Futures Average Order Size has large average order sizes, suggesting increased participation from whale investors, which further supports the bullish view.
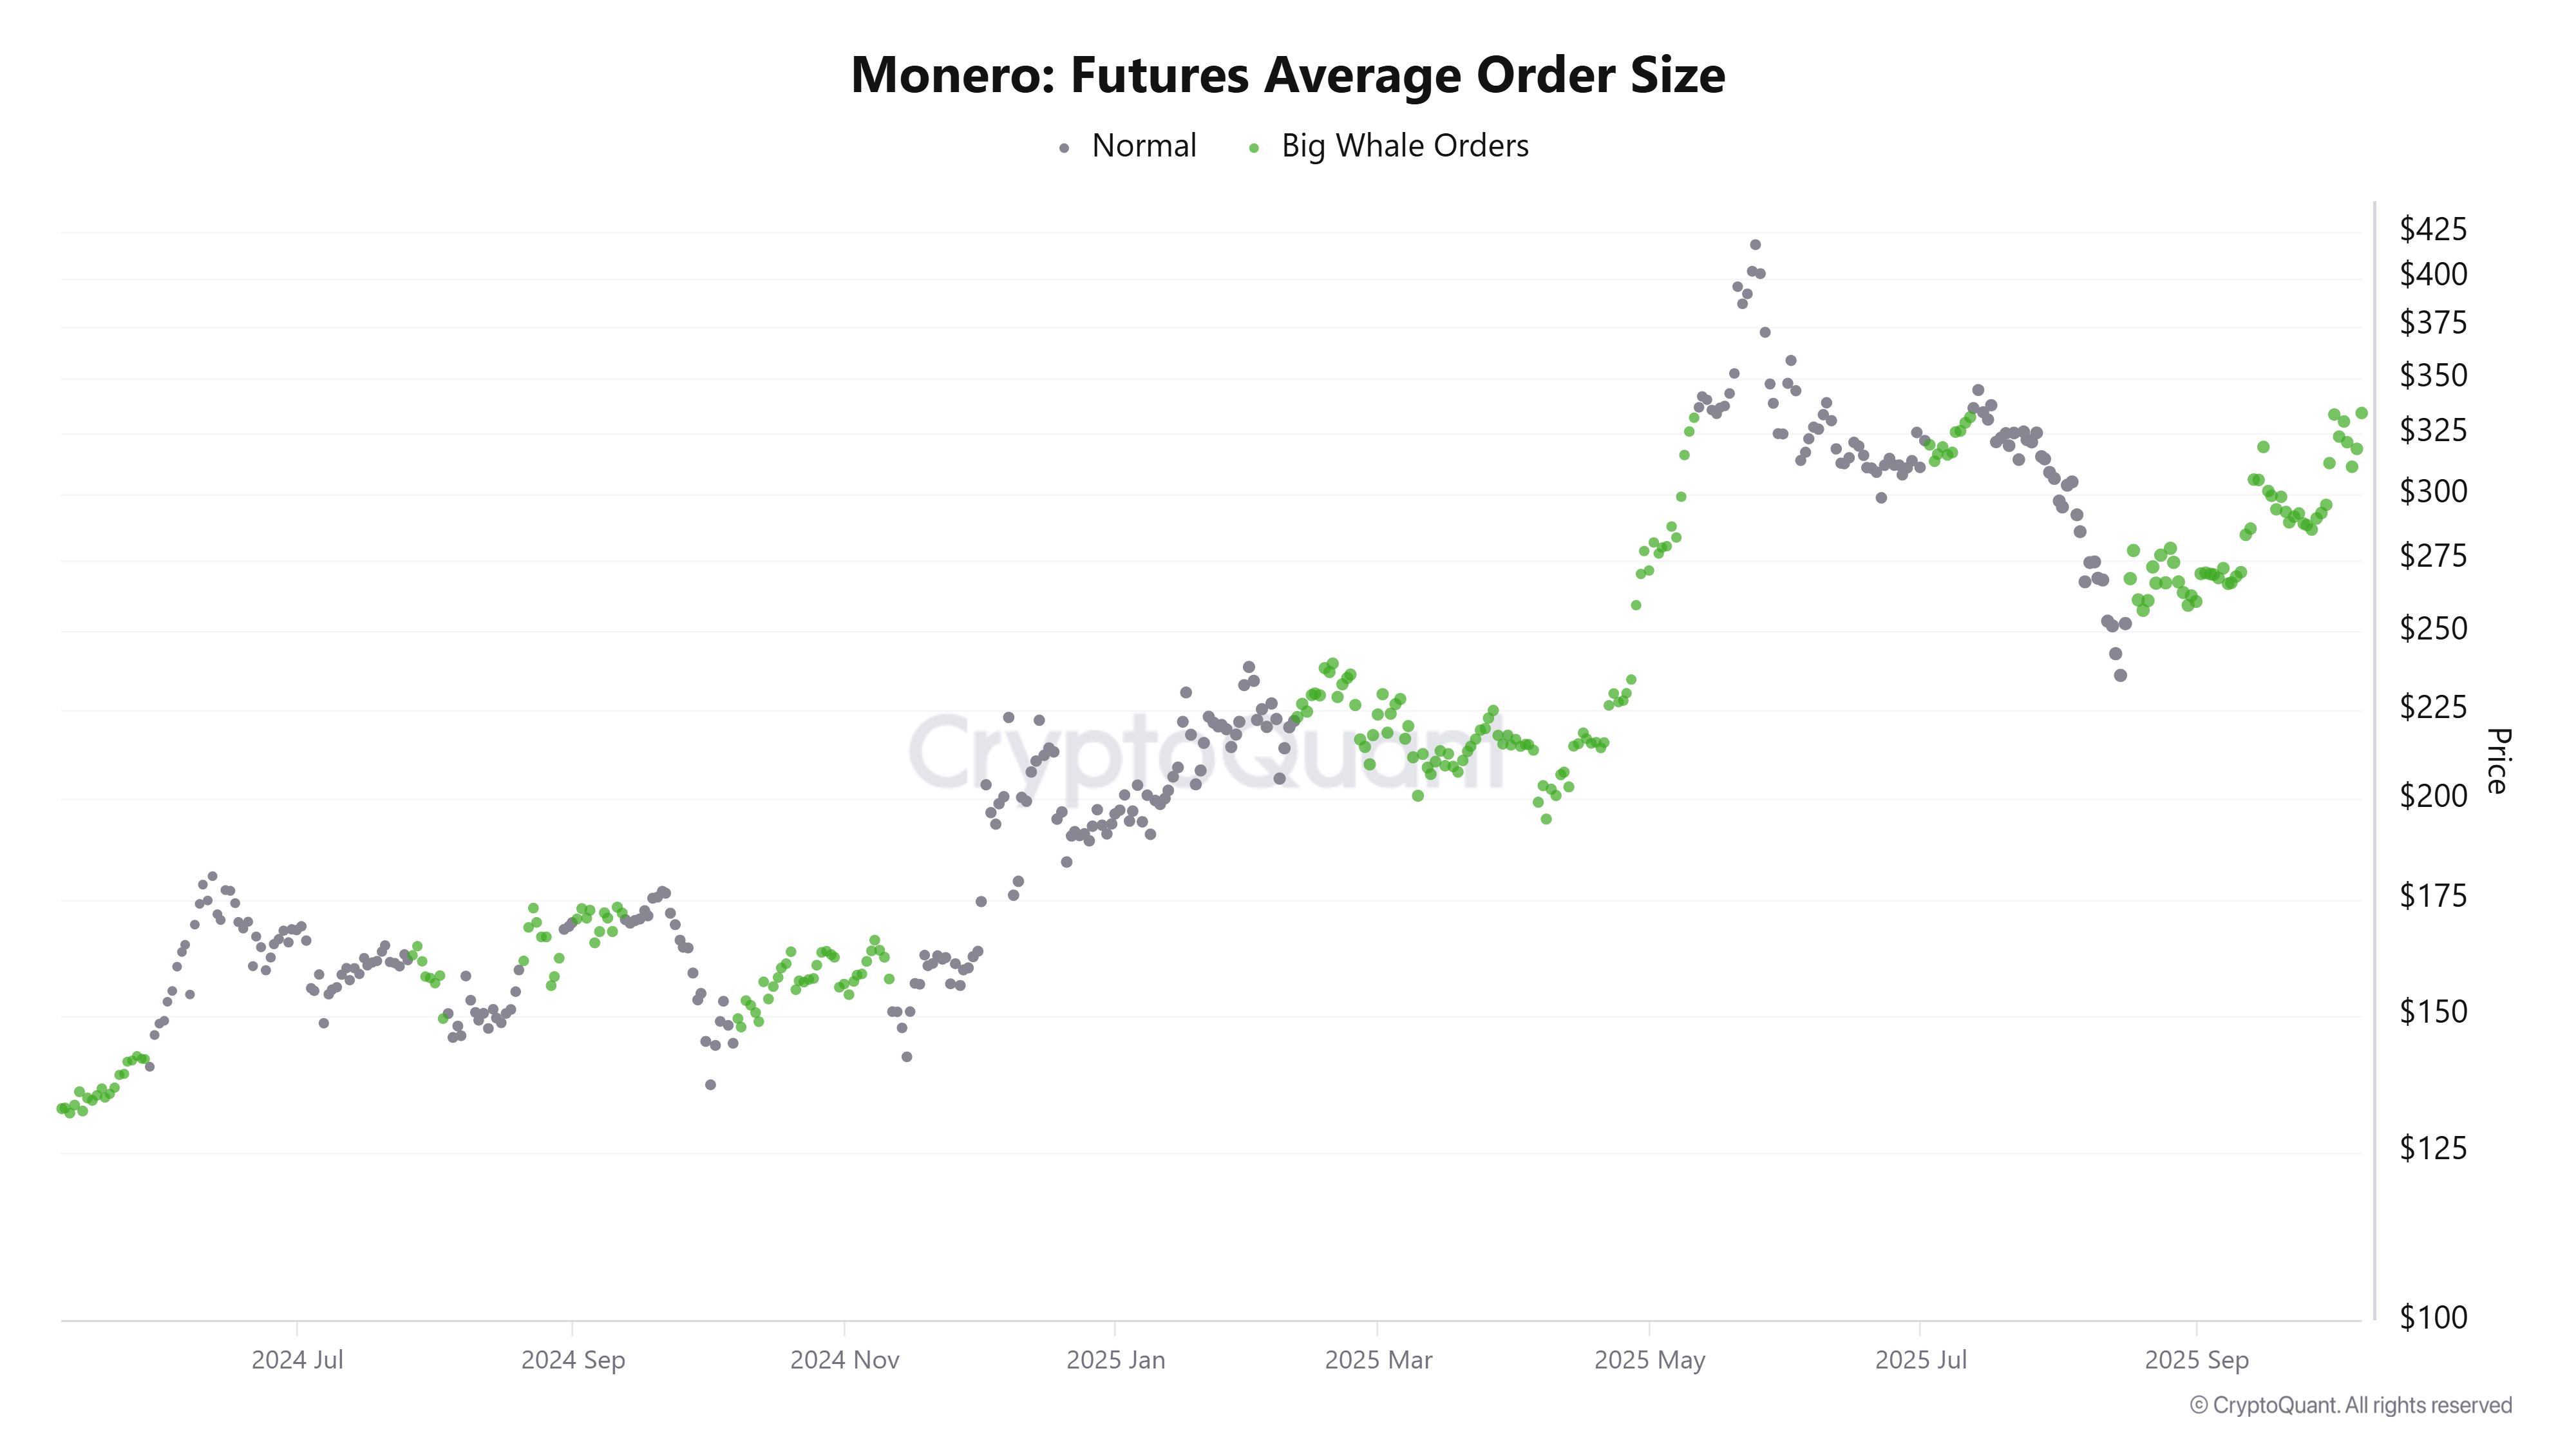
XMR Futures Average Order Size chart. Source: CryptoQuant
Monero Price Forecast: XMR bulls targeting four-month highs
Monero price retested and found support around the 50% retracement level at $288.91 on September 29, and rose by more than 11% last week. As of this week on Tuesday, XMR continued its gains, closing above $333.46 the next day. At the time of writing on Thursday, XMR trades around $333.
If XMR continues its upward trend, it could extend the rally toward the July 14 high of $357.66.
The Relative Strength Index (RSI) on the daily chart reads 64, which is above its neutral level of 50, indicating that bullish momentum is gaining traction. Moreover, the Moving Average Convergence Divergence (MACD) also showed a bullish crossover last week, which remains in effect and still holds, supporting the bullish view.
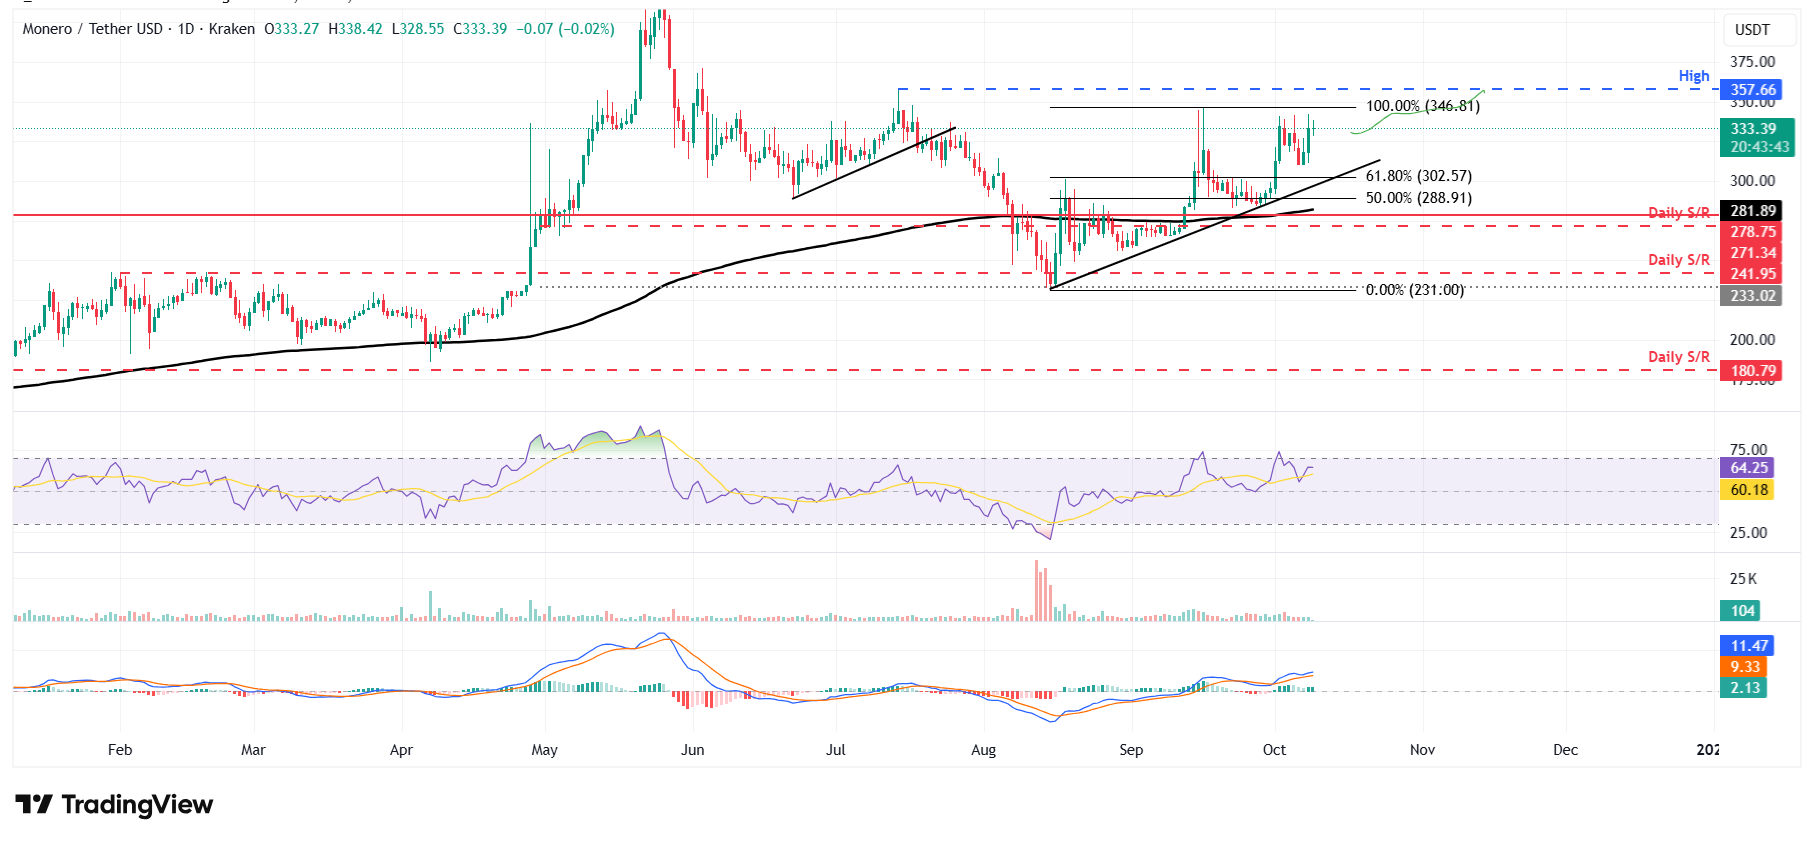
XMR/USDT daily chart
However, if XMR faces a correction, it could extend the decline toward the 61.8% Fibonacci retracement level at $302.57.
Author

Manish Chhetri
FXStreet
Manish Chhetri is a crypto specialist with over four years of experience in the cryptocurrency industry.


