Monero Price Forecast: XMR declines as on-chain metrics signal overheating and renewed selling pressure
- Monero price fell by 8% on Wednesday, following an 11% decline over the last two days.
- On-chain data paint a bearish picture as XMR Spot CVD shows sell-side dominance and retail activity overheating.
- The technical outlook suggests a continuation of the correction targeting the $302.4 mark.

Monero (XMR) fell by more than 8% on Wednesday, following a sharp decline over the last two days. On-chain data supports the bearish thesis, as XMR’s Spot CVD indicates sell-side dominance and overheating conditions among retail investors. The technical outlook suggests weakness and continuation of correction.
Monero’s on-chain metrics show a bearish bias
CryptoQuant data, as shown in the graph below, highlights selling pressure on Monero. The Taker CVD (Cumulative Volume Delta) for XMR has been red and has increased since early May. This indicator measures the cumulative difference between market buy and sell volumes over three months. When 90-day CVD is positive (green) and increasing, it suggests the Taker Buy Dominant Phase, while a negative (red) and decreasing value indicates the Taker Sell Dominant Phase.
-1748408672667.png)
XMR Spot Taker CVD chart. Source: CryptoQuant
Another bearish outlook is CryptoQuant’s Futures Retail Activity Through Trading Frequency Surge data, which shows the overheating conditions. This metric measures the activity level of retail investors in XMR based on their trading frequency. High retail activity indicates that retail traders are flooding into the market, often chasing price movements, which can signal local tops.
-1748408695381.png)
XMR Futures Retail Activity Through Trading Frequency Surge Source: CryptoQuant
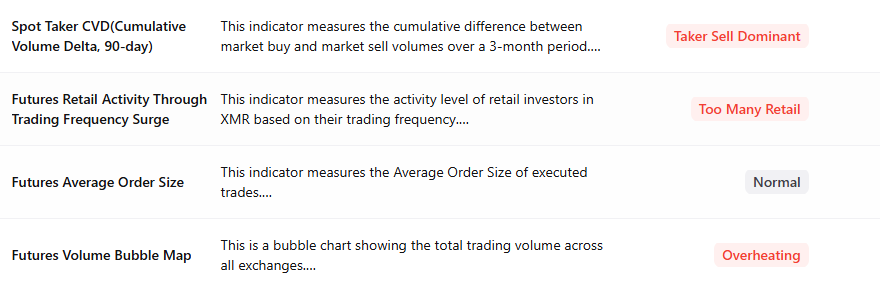
XMR summary chart. Source: CryptoQuant
Monero Price Forecast: XMR bears take control
Monero price has rallied by more than 55% since early May. A correction generally follows after such a massive rally. At the start of this week on Monday, XMR faced a pullback of more than 11% until the next day. At the time of writing on Wednesday, it continues to trade down by 8% at around $338.73
If XMR continues its correction, it could extend the decline to retest its 50% price retracement at $303.61, drawn from the April low of $185.93 to the May high of $420.08.
The Relative Strength Index (RSI) on the daily chart reads 49, sharply rejecting its overbought level of 70, and slips below its neutral value of 50, indicating strong bearish momentum. The Moving Average Convergence Divergence (MACD) also showed a bearish crossover, further supporting the bearish conditions.
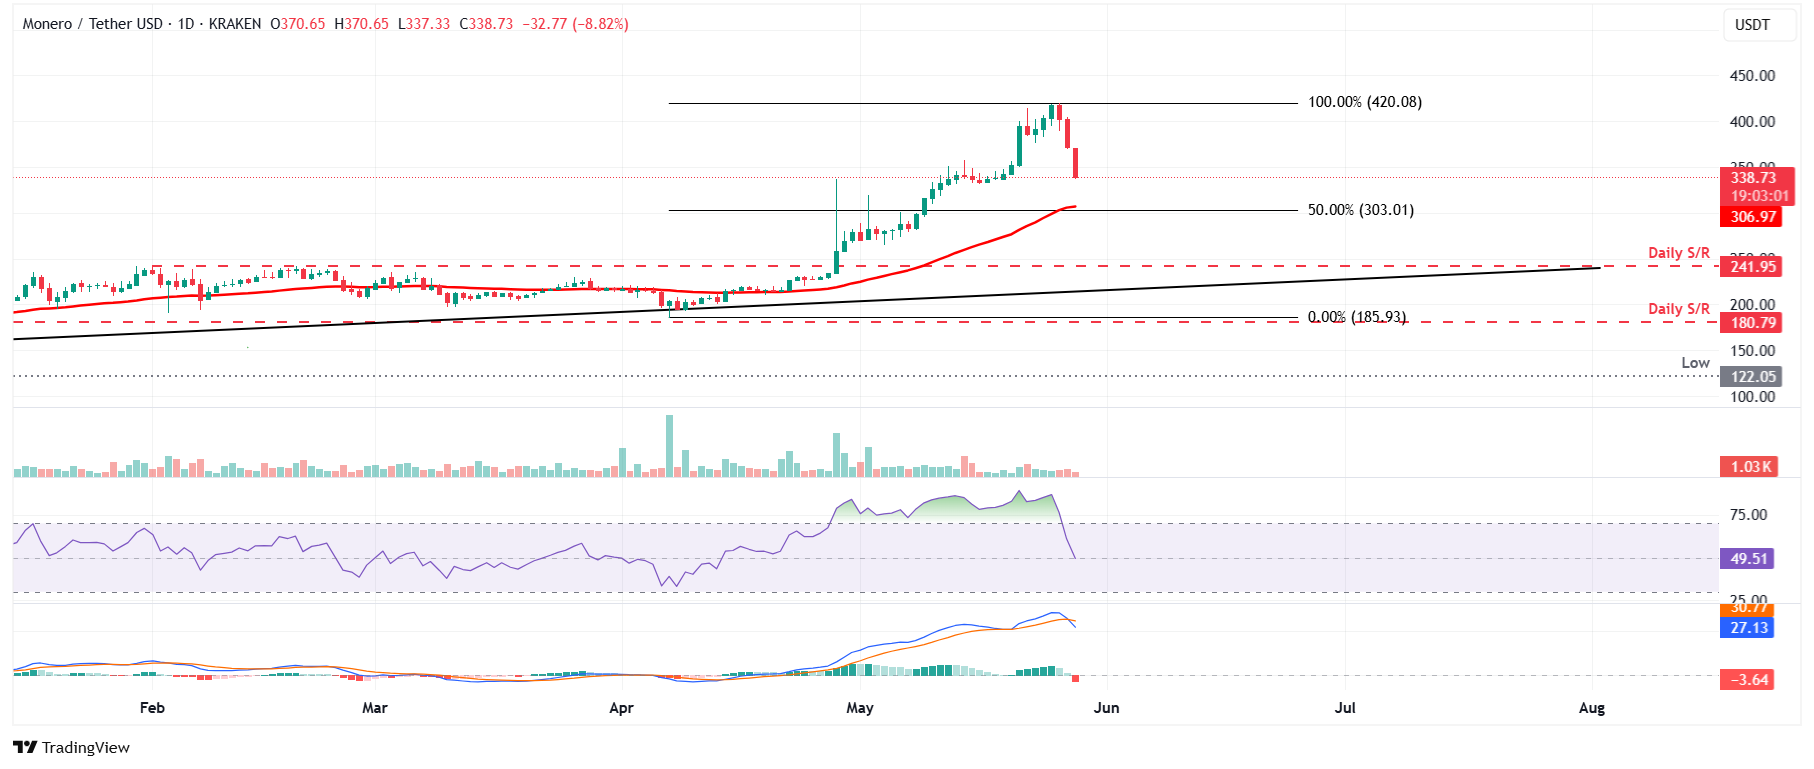
XMR/USDT daily chart
However, if XMR recovers, it could extend the recovery to retest its recent high of $420.
Author

Manish Chhetri
FXStreet
Manish Chhetri is a crypto specialist with over four years of experience in the cryptocurrency industry.


