Monero Price Forecast: Privacy coin hits two-month low
- Monero price trades down over 6% so far this week, hitting its lowest level in two months.
- On-chain and derivatives data point to a bearish outlook, with rising short bets and heightened futures market activity.
- Technical analysis suggests a sustained close below $277.96 could open the door for a deeper correction toward $241.95.

Monero (XMR) price trades in the red around $284 at the time of writing on Thursday, extending its losses by 6% so far this week to hit a fresh two-month low. Bearish sentiment is growing, as reflected in rising short positions and increased activity in the futures market. The technical analysis suggests that a sustained close below the $277.96 support level could pave the way for a deeper pullback toward the $241.95 mark.
Monero’s risk of further downside grows as short interest spikes
CoinGlass data indicates that Monero’s long-to-short ratio at all exchanges shows 53.04% of traders are betting on the asset price to fall.
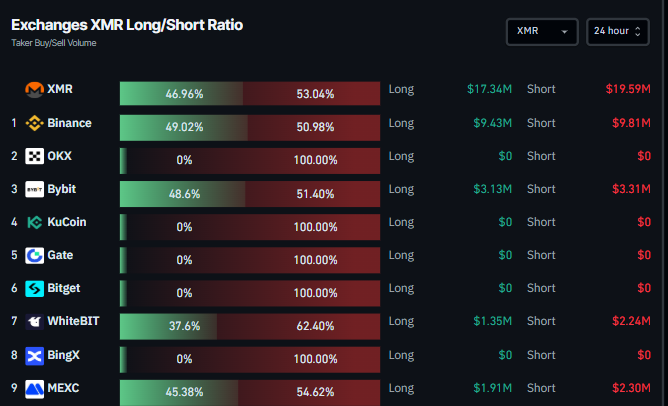
Exchange XMR long-to-short ratio chart. Source: Coinglass
CryptoQuant’s summary data also indicates that Monero’s futures market activity is heating up as more traders are opening leveraged positions alongside negative Spot Taker CVD, signaling a potential correction ahead.
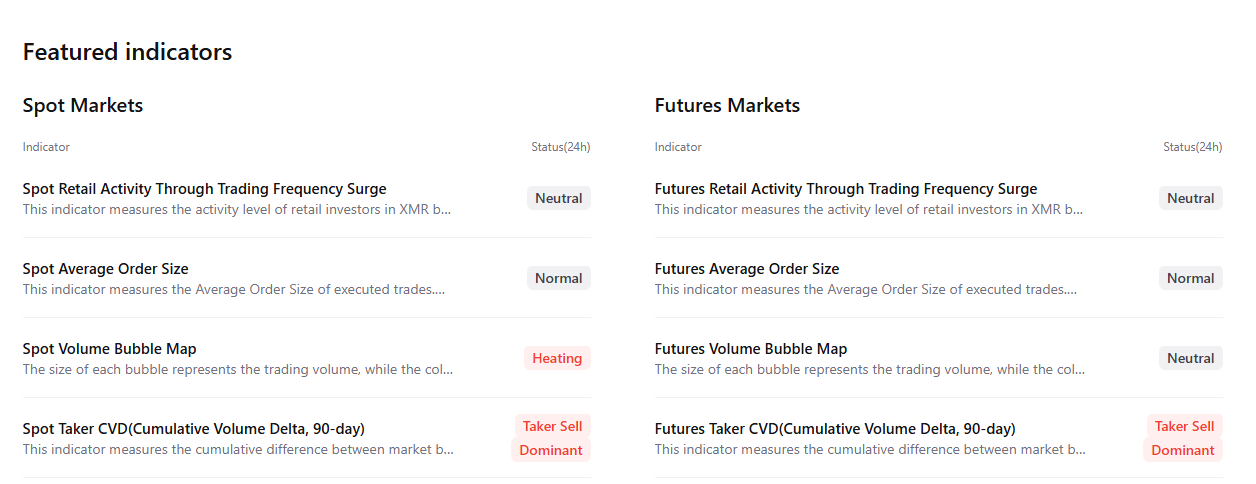
Monero Price Forecast: XMR bears aiming for $241 mark
Monero price faced rejection from its previously broken ascending trendline (drawn by connecting multiple lows since mid-June) on July 25 and declined more than 12% in the next 13 days to reach the lowest level since May 7. At the time of writing on Thursday, it continues to trade below $284.
If XMR continues its downward trend and closes below its 200-day Exponential Moving Average (EMA) at $277.93, it could extend the correction to retest its daily support at $241.95.
The Relative Strength Index (RSI) indicator and Awesome Oscillator (AO) on the daily chart are trading below the neutral levels of 50 and zero, respectively. These momentum indicators strongly indicate bearish dominance. The Moving Average Convergence Divergence (MACD) showed a bearish crossover on July 20 that still holds, also indicating bearish momentum.
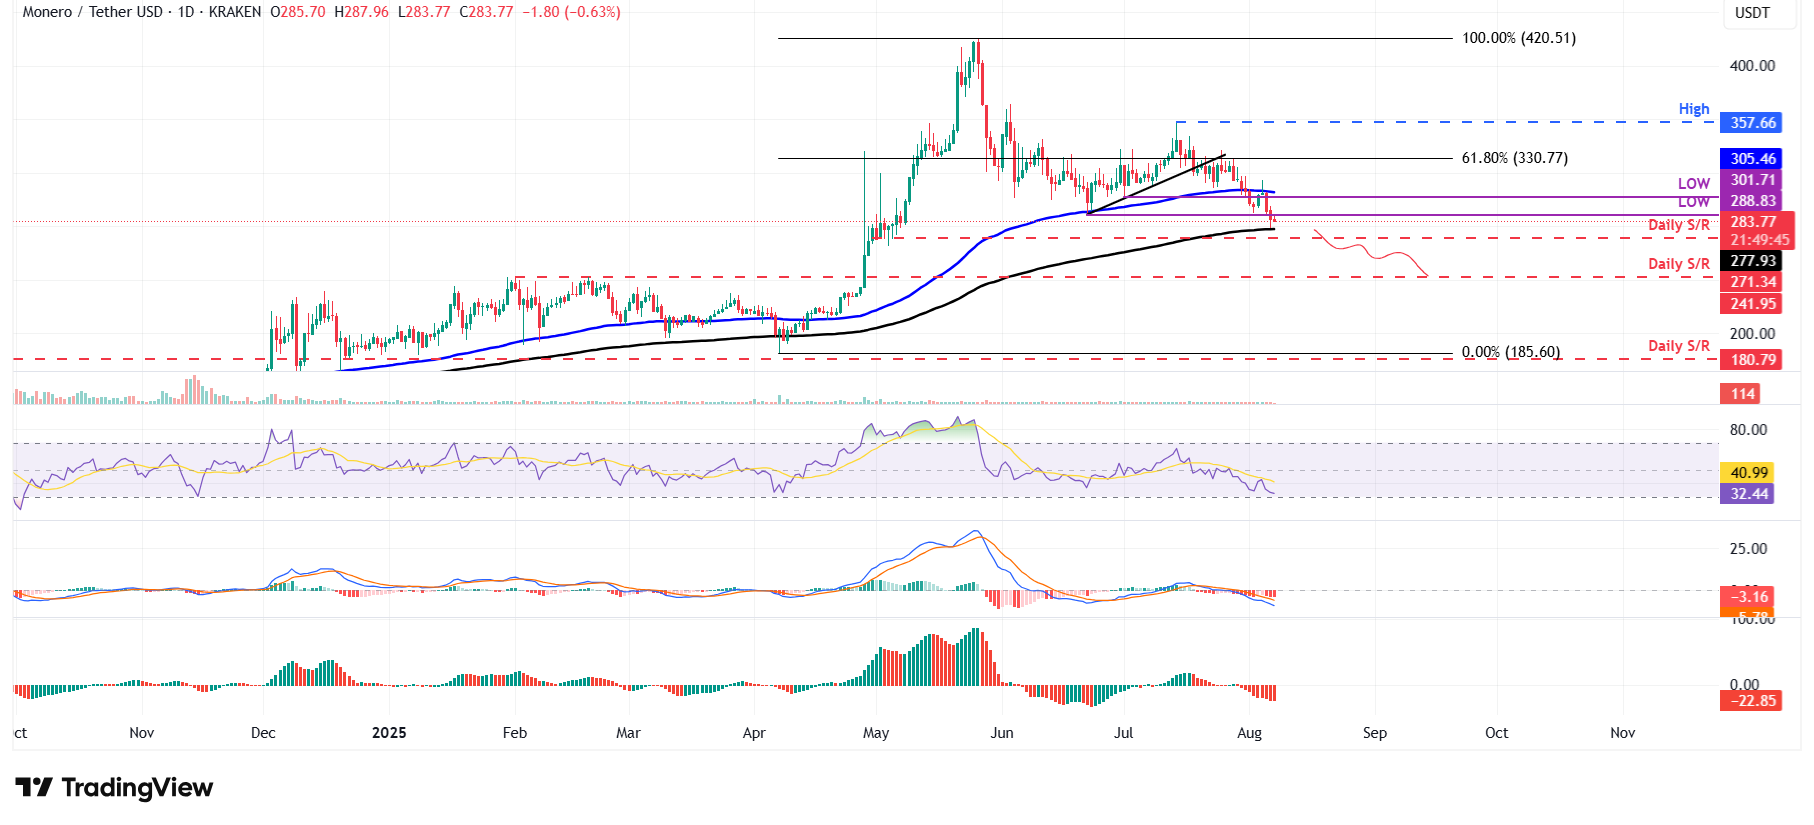
XMR/USDT daily chart
However, if XMR recovers, it could extend the recovery toward its 100-day EMA at $305.46.
Author

Manish Chhetri
FXStreet
Manish Chhetri is a crypto specialist with over four years of experience in the cryptocurrency industry.



