|

Monero Price Forecast: Bearish bets rise as XMR extends correction below $400

  • Monero records a loss of over 9% so far on Wednesday, dropping below $370. 
  • Derivatives data indicate a surge in bearish bets as futures Open Interest declines. 
  • The technical outlook remains to the downside as XMR risks breaking the neckline of a double top pattern. 

Monero (XMR) falls by over 9% at press time on Wednesday, erasing the gains from the recovery seen late in the previous week. The intraday drop stokes fear among traders, prompting a surge of bearish bets in the derivatives market. Monero risks a further correction as technical indicators flash a sell signal amid resurgent bearish momentum. 

Monero suffers from reduced market demand

Monero is losing demand among retail traders. CoinGlass data shows that XMR futures Open Interest (OI) dropped 3.14% to $78.47 million over the last 24 hours, suggesting that traders are withdrawing capital amid a short-term correction that is tainting hopes of a future recovery. 
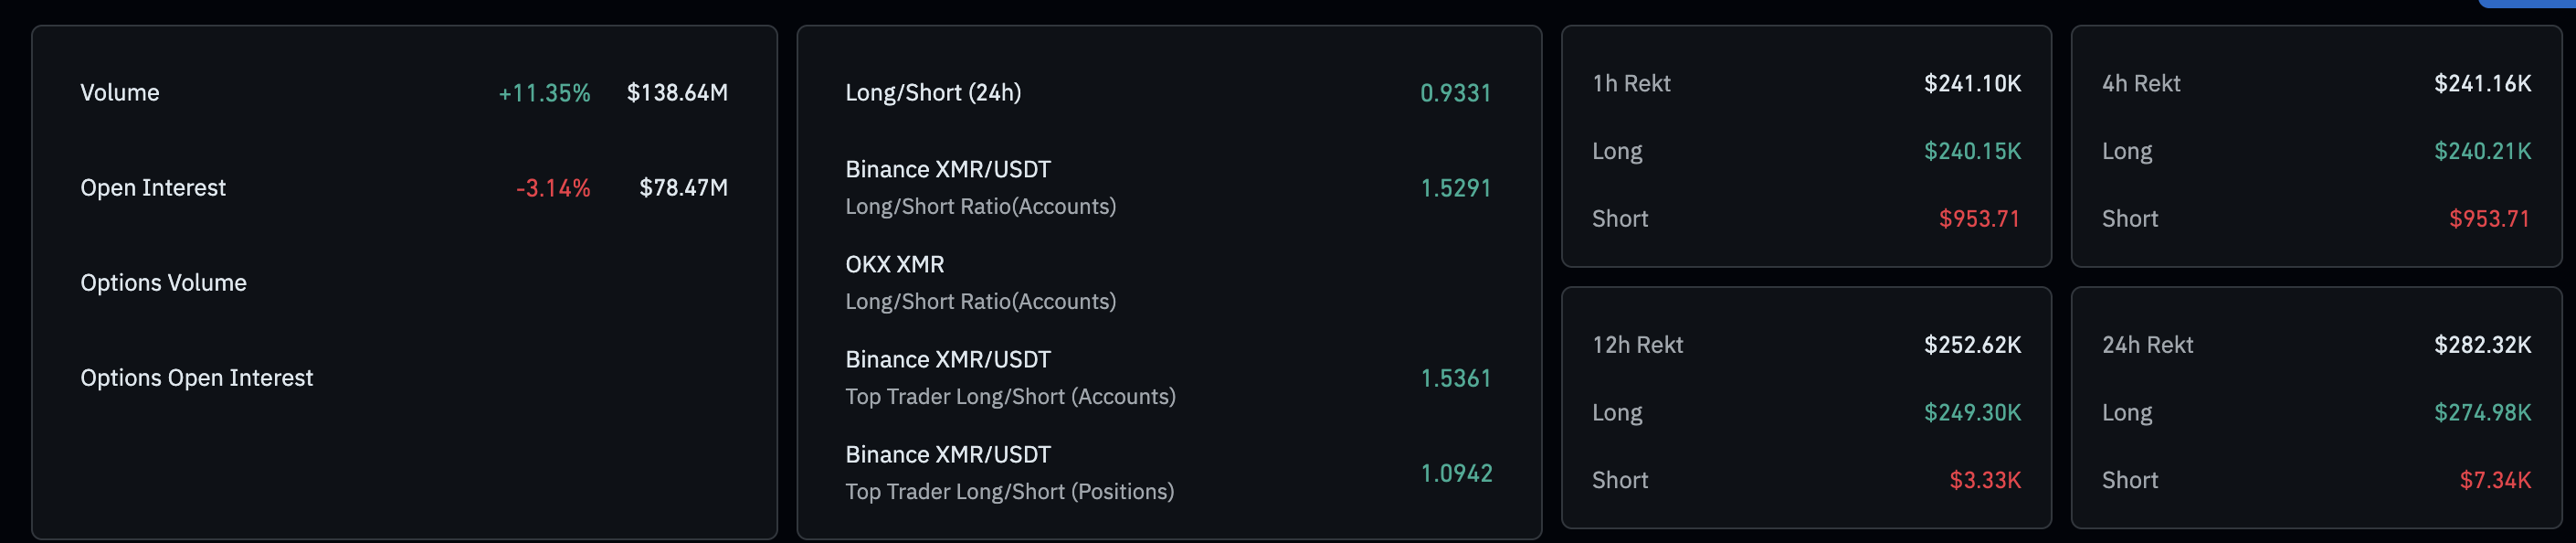
XMR derivatives data. Source: CoinGlass.

In line with rising fear, the XMR long-to-short ratio chart shows that short positions account for 55.48% of all trades in the last 24 hours, dropping the ratio to 0.8025. Monero could experience further selling as bearish bets increase and the futures market declines. 
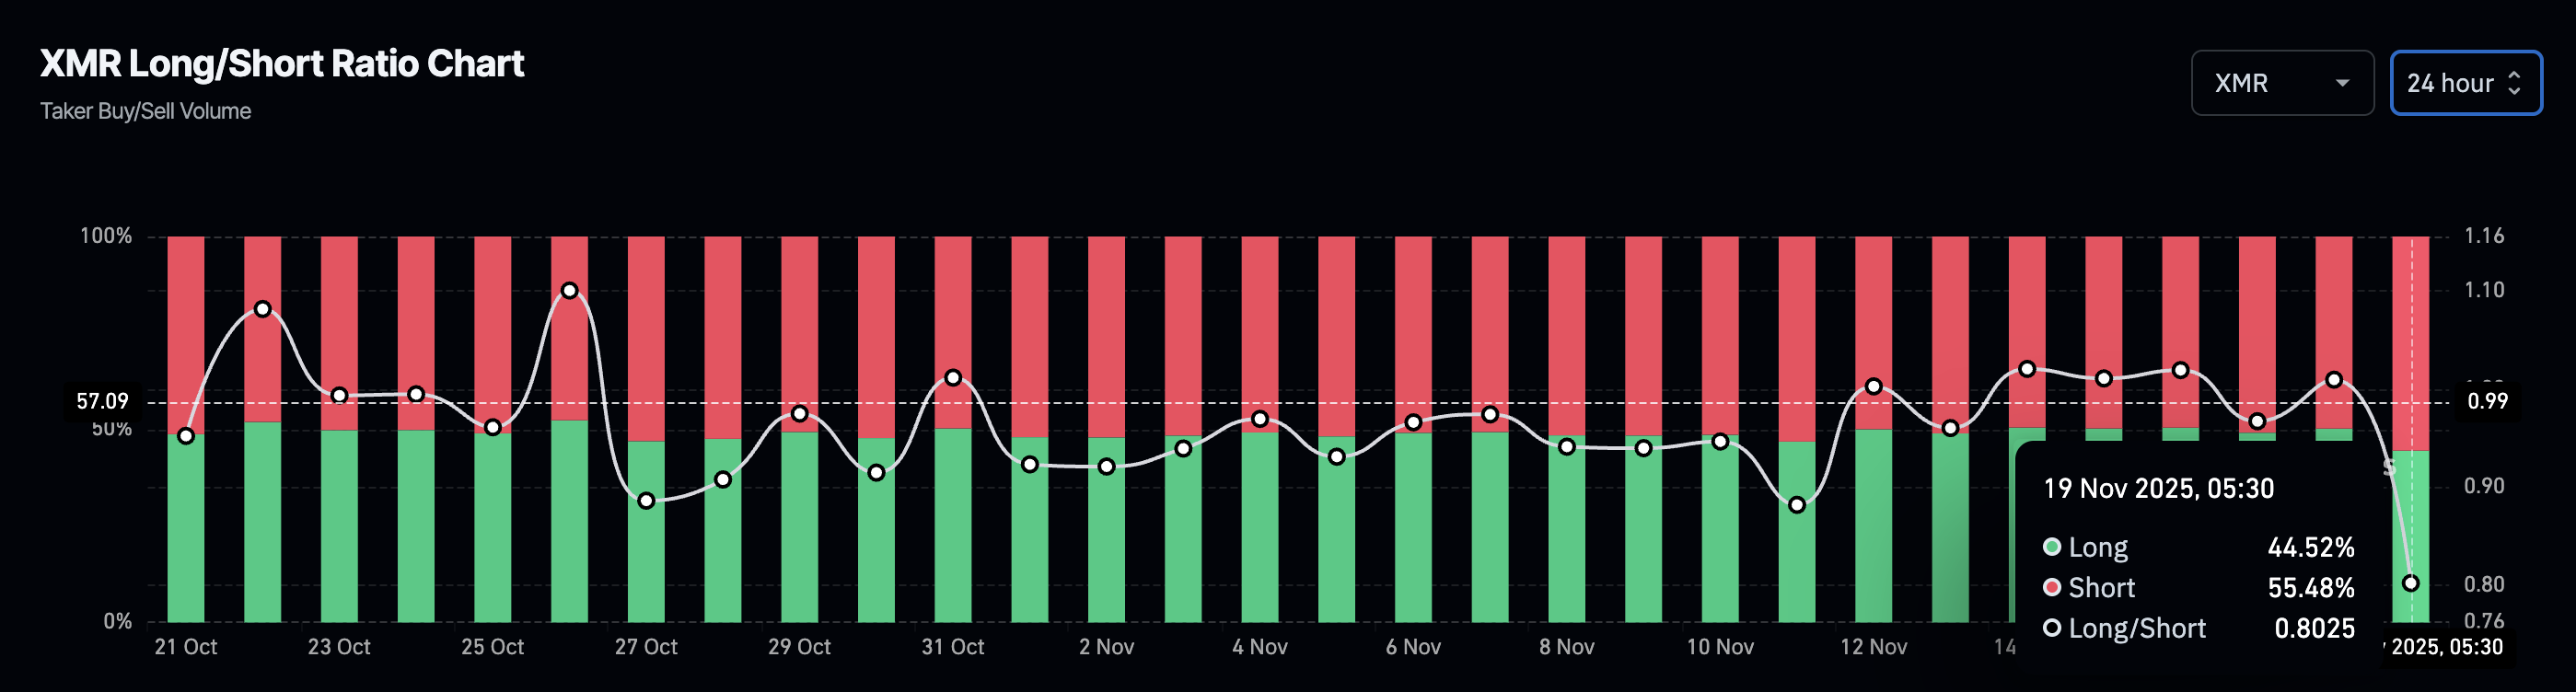
XMR long-to-short ratio chart. Source: CoinGlass.

Monero could test its crucial EMAs

Monero’s intraday drop marks the fourth straight day of selling, which has erased the prevailing demand. The Relative Strength Index (RSI) is down to 48 on the daily chart, slipping below the midline, indicating a wipeout of buying pressure and a dominant shift to selling.  

Adding points to XMR bears, the Moving Average Convergence Divergence (MACD) flashes a sell signal as the blue line crosses below the red signal line, indicating renewed bearish momentum. 

The immediate support for Monero is the 50-day Exponential Moving Average (EMA) at $348, followed by the 100-day and 200-day EMAs at $326 and $304, respectively. Technically, if XMR ends the day below $358, which aligns with the July 14 high, it would confirm the breakout of a double-top pattern, as previously reported by FXStreet.
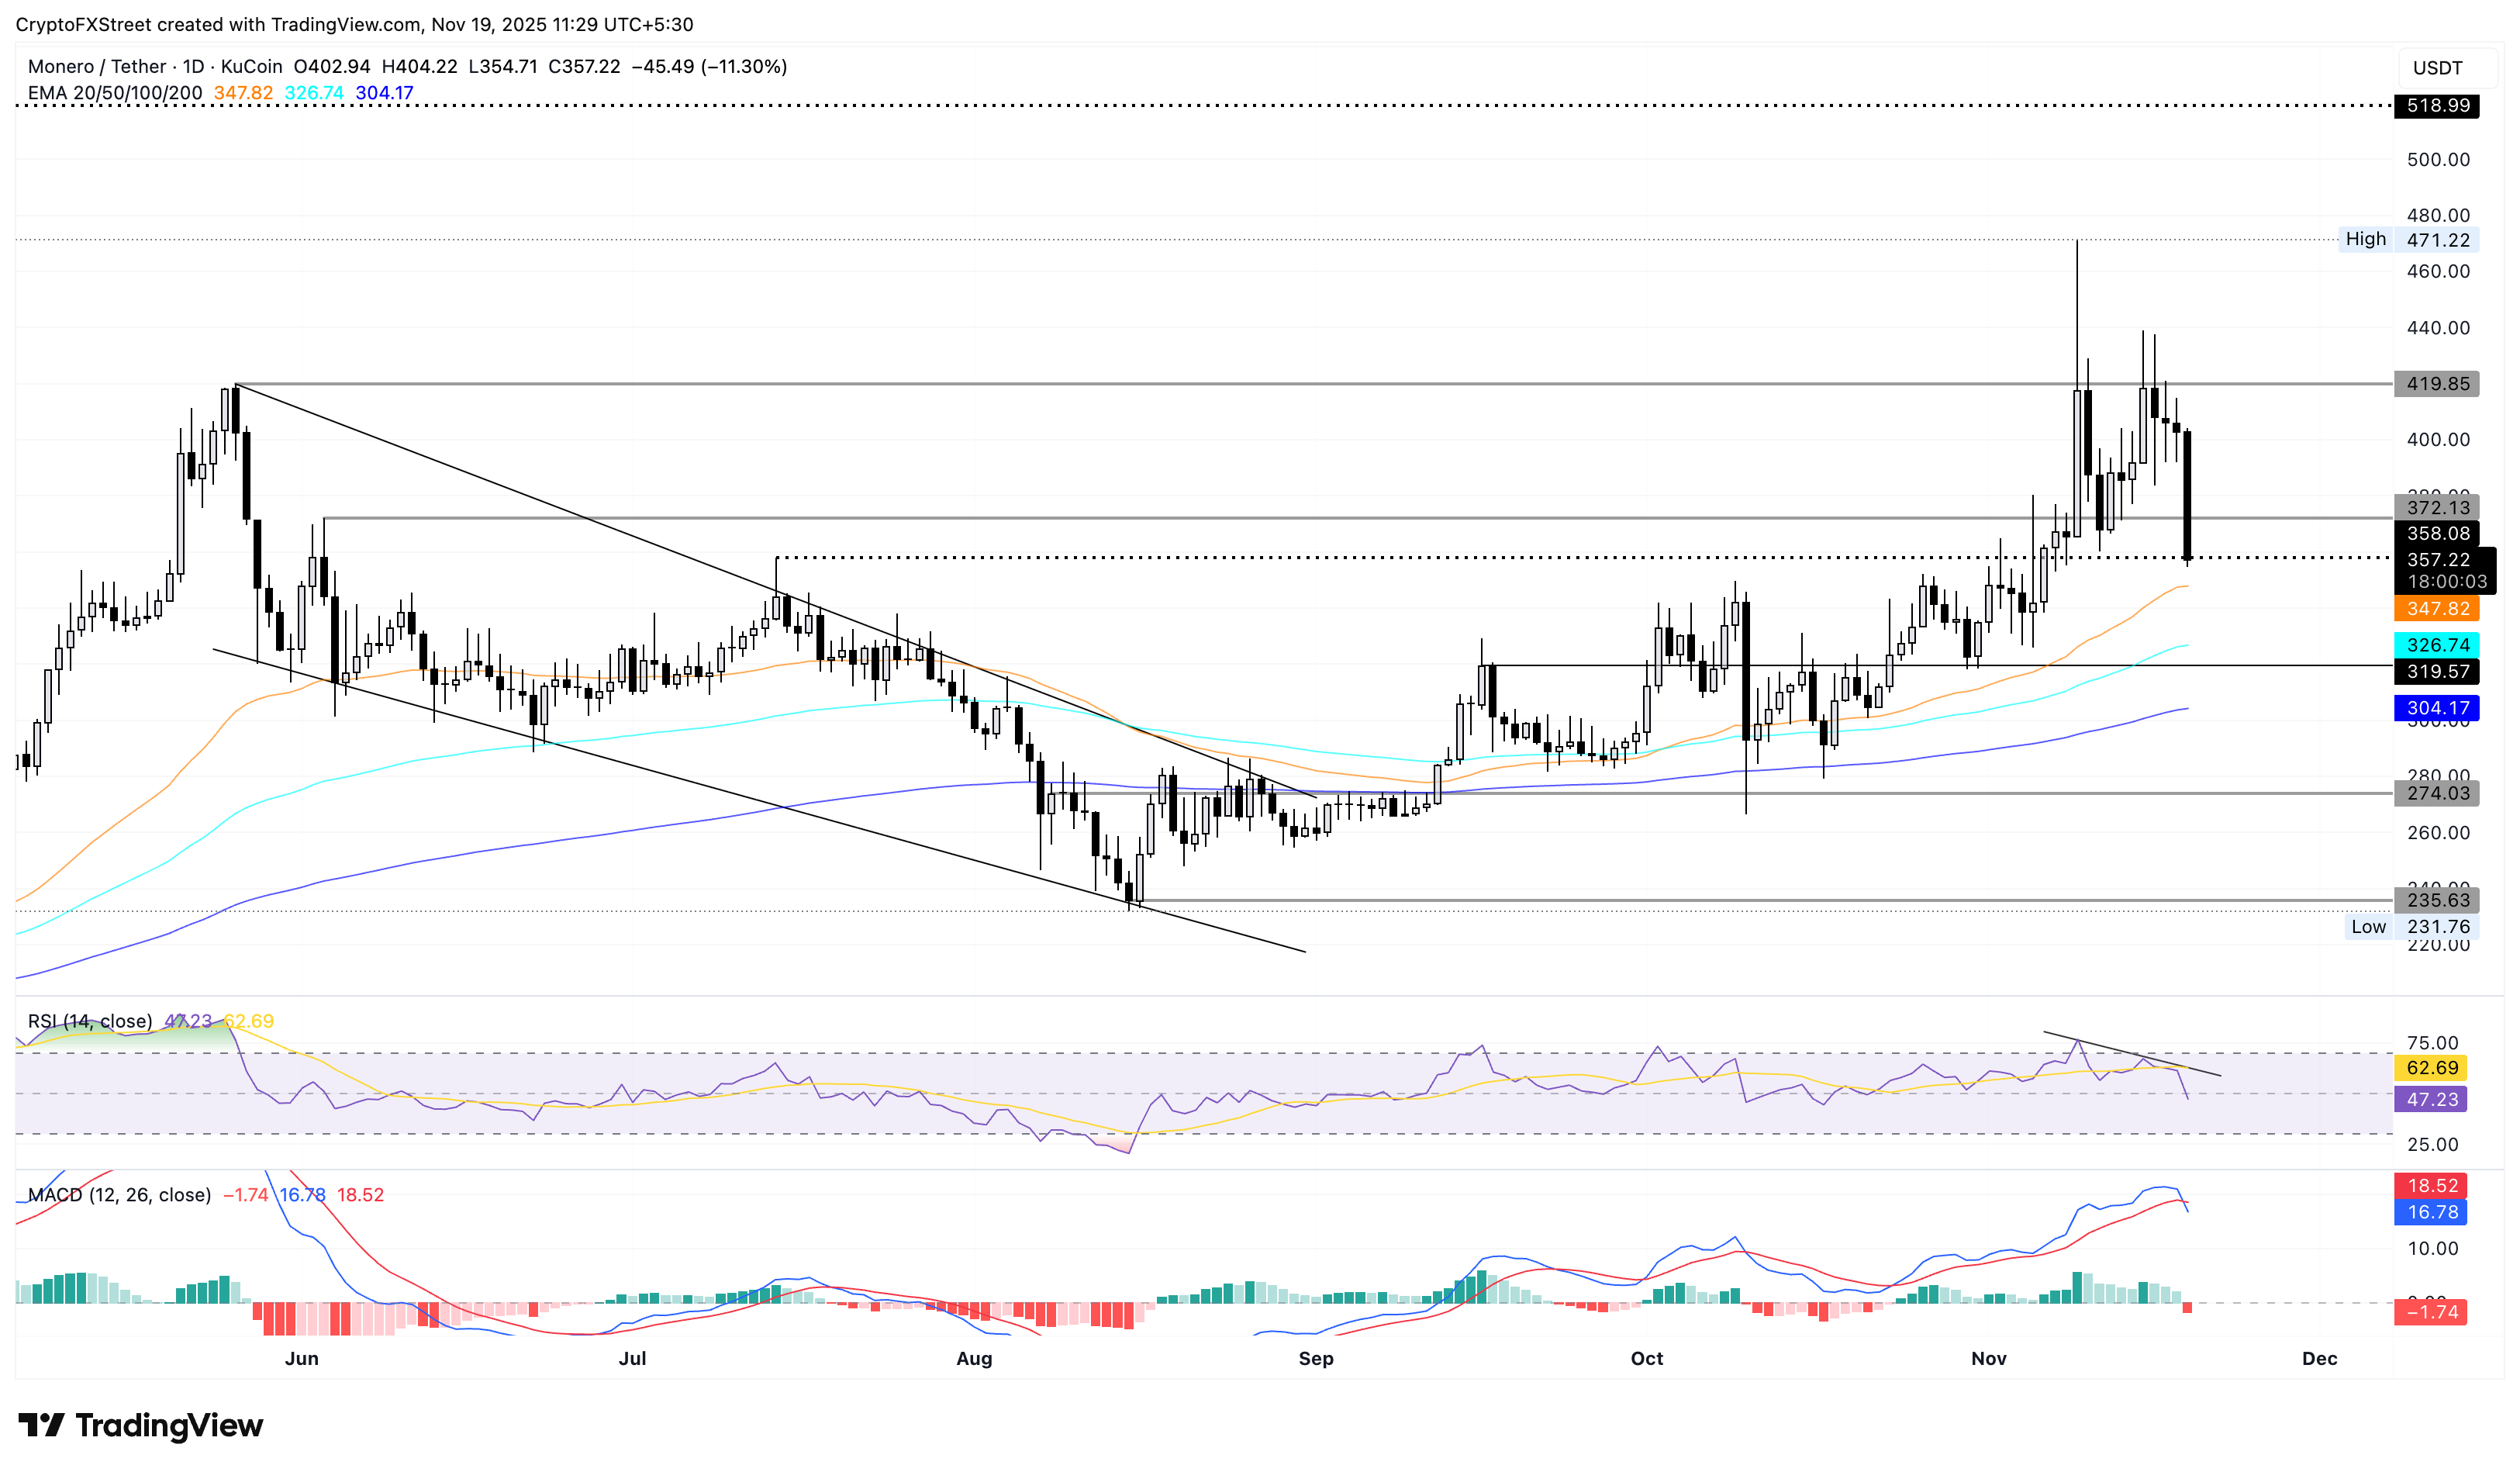
XMR/USDT daily price chart.

On the flipside, if Monero rebounds, the key resistance remains at the June 3 high of $372.

Author

Vishal Dixit

Vishal Dixit

FXStreet

Vishal Dixit holds a B.Sc. in Chemistry from Wilson College but found his true calling in the world of crypto.


More from Vishal Dixit
Share:

Editor's Picks

Bitcoin Weekly Forecast: BTC retreats as macro headwinds grow
Bitcoin (BTC) remains under pressure, down over 4% this week and trading around $76,900 at the time of writing on Friday. Institutional demand shows signs of weakness as spot BTC Exchange Traded Funds (ETFs) are on track to end their three-week inflow streak, recording nearly $500 million in net outflows through Thursday.
XRP falls toward key support as macro uncertainty, weak momentum cap recovery
Ripple (XRP) falls below $1.33 on Friday, marking the third consecutive day of declines. The token continues to track the broader cryptocurrency market downturn, with investors closely monitoring heightened macroeconomic uncertainty ahead of the United States (US) Consumer Price Index (CPI) release and next week’s Federal Reserve (Fed) monetary policy decision.
Crypto Today: Bitcoin, Ethereum, XRP stabilize at lower levels amid ETF outflows and macroeconomic risks
The broader cryptocurrency market is rising on Friday, with Bitcoin (BTC) trading above $77,000 after testing lower support near $76,500. Ethereum (ETH) shows signs of stability, hovering above the support provided at $2,400 despite capped upside at $2,500. Meanwhile, Ripple (XRP) holds above $1.33 after three straight days of declines, reflecting growing headwinds due to macroeconomic uncertainty.
Bitcoin pulls back as another golden cross fails to deliver
Earlier this week, Bitcoin formed a golden cross, a technical signal that occurs when the price’s 50-day moving average rises above the 200-day moving average and is conventionally viewed as a precursor to a bullish rally. Historically, however, that’s often not been the case.
Bitcoin: BTC retreats as macro headwinds grow
Bitcoin (BTC) remains under pressure, down over 4% this week and trading around $76,900 at the time of writing on Friday. Institutional demand shows signs of weakness as spot BTC Exchange Traded Funds (ETFs) are on track to end their three-week inflow streak, recording nearly $500 million in net outflows through Thursday.