Monero price analysis: XMR/USD trends in an upward channel formation
- XMR/USD is floating above the SMA 20 and SMA 50 curves.
- The RSI indicator is trending around 62.15.

XMR/USD is trending in an upwards channel formation, despite having a bearish start to the day. So far this Thursday, XMR/USD has gone down from $65.50 to $65. This follows a heavily bullish Wednesday wherein Monero went up from $62.25 to $65.25. The hourly breakdown of Wednesday and Thursday shows us that XMR/USD bulls managed to bounce off intraday support at $62. The price gathered enough momentum to go up to $65.50, before settling around $65.
XMR/USD daily chart
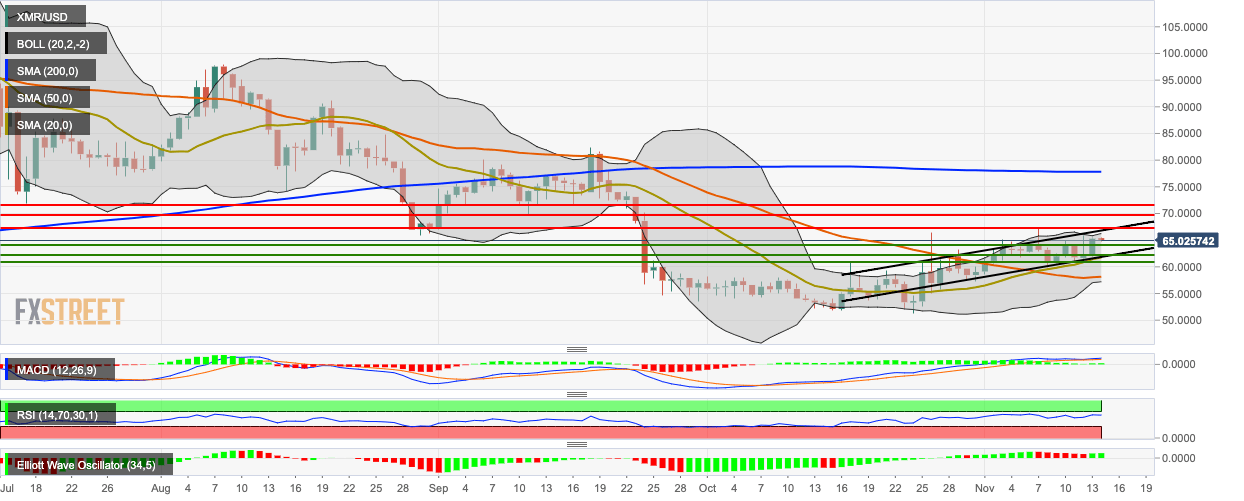
The daily price is floating around the 20-day Simple Moving Average (SMA 20) and SMA 50 curves. The Moving Average Convergence/Divergence (MACD) indicates decreasing bullish momentum, while the Elliott Oscillator has had two green sessions following six straight red sessions. The Relative Strength Index (RSI) indicator is trending around 62.15.
Author

Rajarshi Mitra
Independent Analyst
Rajarshi entered the blockchain space in 2016. He is a blockchain researcher who has worked for Blockgeeks and has done research work for several ICOs. He gets regularly invited to give talks on the blockchain technology and cryptocurrencies.


