Monero Price Analysis: XMR jumps by more than 70% over the last one month
- XMR reached an intraday high of $138.50, a level not seen since September 2018.
- XMR has flashed the sell signal in its 12-hour chart, prompting a short-term correction.

Monero is currently in the middle of a bullish rally and has reached its highest levels since early September 2018. Since September 3, 2020, the leading privacy coin has jumped by 73% from $77 to $133. The network is currently prepping for a major network upgrade that will take place on October 17.
GUI v0.17.0.1 'Oxygen Orion' has been released!https://t.co/l12hrYf1ir
— Monero || #xmr (@monero) October 5, 2020
Please be reminded that a scheduled network upgrade will take place on October 17. Users, services, merchants, pool operators, and exchanges should run v0.17 to be sufficiently prepared.
Analysts have also argued that the positive pierce action over the last two days may have come in response to the U.S. Department of Justice (DOJ), instructing companies to install encryption backdoors. The DOJ’s statement reads:
We call on technology companies to work with governments to take the following steps, focused on reasonable, technically feasible solutions: Embed the safety of the public in system designs… Enable law enforcement access to content in a readable and usable format where an authorization is lawfully issued… Engage in consultation with governments and other stakeholders to facilitate legal access.
It’s not possible to have such a backdoor installed in Monero’s protocol without everybody noticing. As such, the analysts claim that this may have triggered XMR to jump from $116 to a high of $138.50 over the last 48 hours.
Privacy coin demand on the rise, Monero leading: Privacy coin demand is on the rise right after the United States Department of Justices (DoJ) issued a report that is coming in really tough on the privacy coins. Well, the first speculation could be… https://t.co/dvMeynmV7Q pic.twitter.com/jfRYNnfUsb
— Harald Schendera (@HSchendera) October 12, 2020
The technical picture
XMR is presently trending in an ascending channel formation. As previously mentioned, XMR reached an intraday high of $138.50 this Monday, a level not seen since September 2018. The MACD shows increasing bullish momentum, which the buyers will want to take advantage of to break above the $140 resistance level.
XMR/USD daily chart
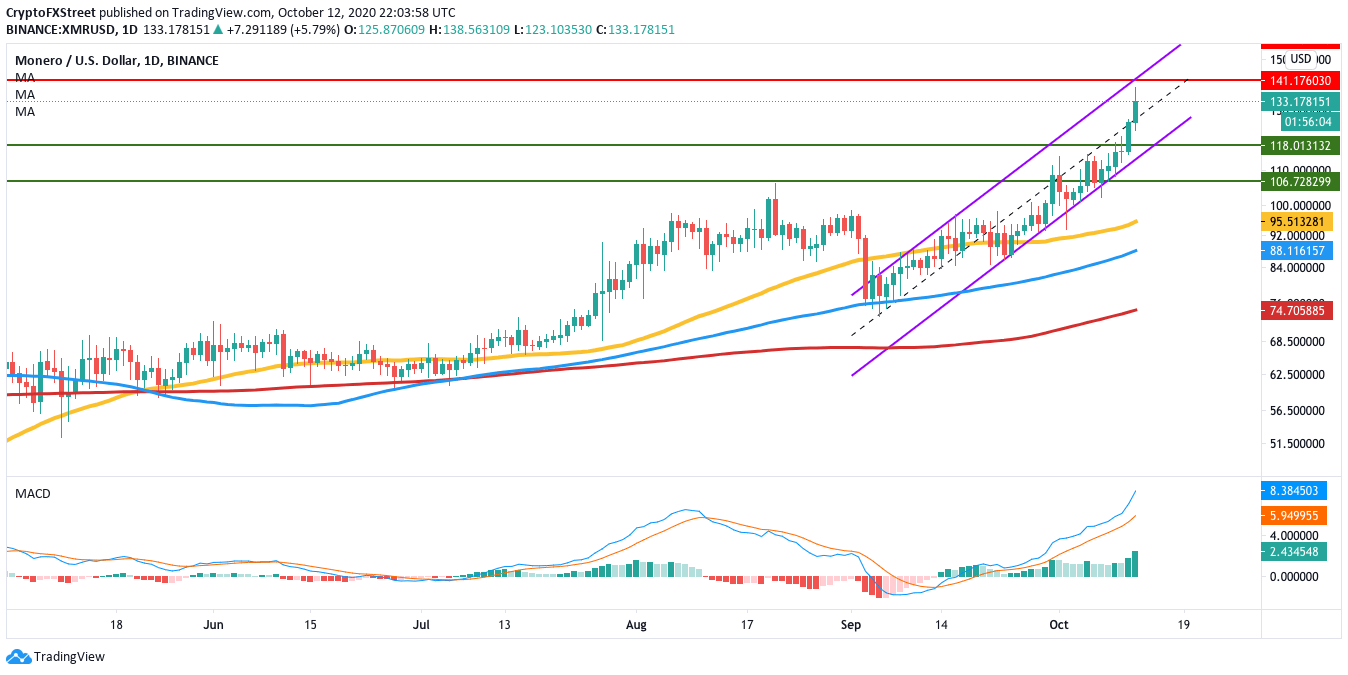
If the buyers do manage to break past this level, the price should reach the $160 resistance.
The flipside: Is a bearish correction imminent?
Looking into the 12-hour time frame, there are a couple of indicators that show that the price may go through a short-term bearish correction before continuing its upward swing. The first thing to note is that the relative strength index is hovering above 70, meaning that the privacy coin is currently overpriced.
XMR/USD 12-hour chart
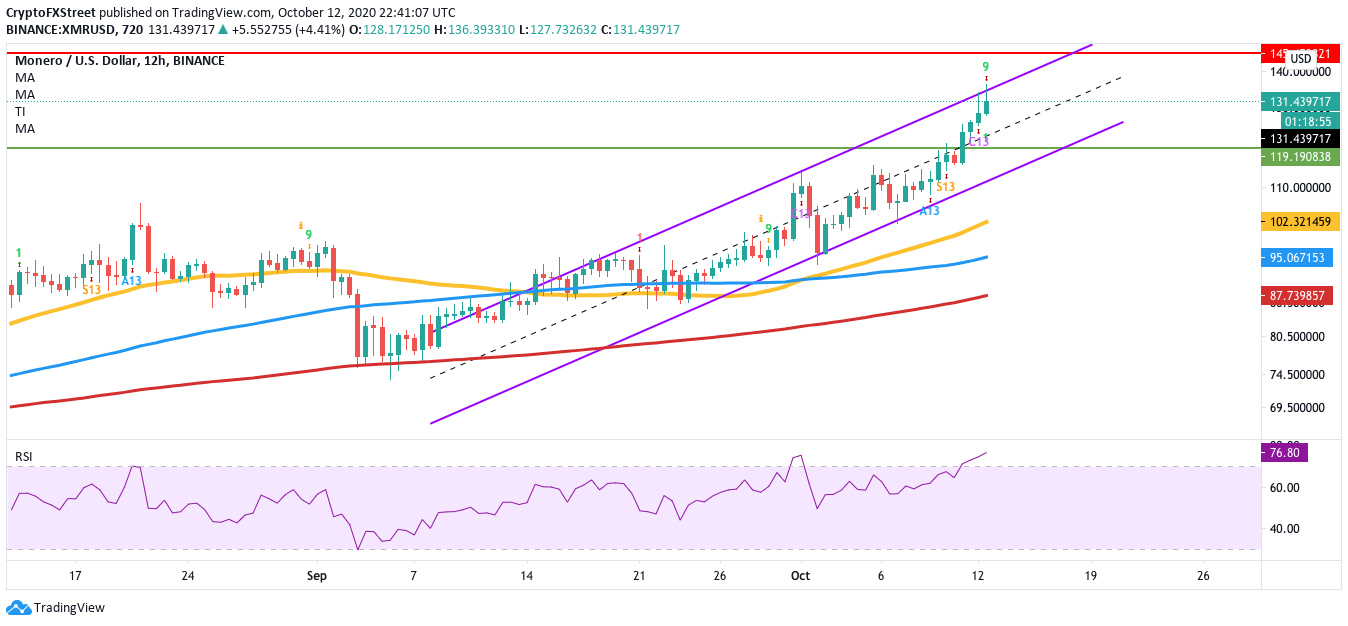
The second thing to note is that the TD sequential indicator has flashed the sell signal. Both these indicators should prompt the sellers to correct the price. The downside is currently capped off at the $120 support line. If the bears manage to break past this level, the next viable support lies at the lower bound of the parallel channel (~$112). If the bears manage to break past this level, it could be pretty catastrophic as the next healthy support lies at the 50-bar SMA ($102). Analyzing the social media behavior over the last 24 hours surrounding the privacy asset also gives more fuel to this short-term bearish hypothesis.
XMR social volume
 [04.37.37, 13 Oct, 2020]-637381430050861115.png)
High social notoriety isn’t usually a good sign for a digital asset. If social media volume increases when a cryptocurrency “pumps,” it’s usually a sign of people quickly joining in on the action because of FUD. This is why a spike in social volume inevitably leads to a price correction. As can be seen, there is a significant spike on October 12, which hints at a short-term drop in price.
Key price levels to watch
XMR bulls will want to continue their uptrend by breaking past the $140 resistance line. If the buyers do manage to do so, they will next aim for the $160 resistance level. Technical analysis shows that XMR may go through a short-term price correction before continuing its upswing. In this case, the downside is capped at the $120 support line.
Author

Rajarshi Mitra
Independent Analyst
Rajarshi entered the blockchain space in 2016. He is a blockchain researcher who has worked for Blockgeeks and has done research work for several ICOs. He gets regularly invited to give talks on the blockchain technology and cryptocurrencies.


