Meme Coins Price Prediction: Dogecoin, Shiba Inu, Pepe break below critical support levels
- Dogecoin drops over 2% on Friday, extending a downfall below December’s low.
- Shiba Inu extends the broader four-week decline with an over 2% loss on Friday.
- Pepe reverses from the 50-day EMA for three consecutive days of losses, accounting for over 8% decline.

Meme coins, led by Dogecoin (DOGE), Shiba Inu (SHIB), and Pepe (PEPE), are down so far this week, extending the prevailing decline. The technical outlook for DOGE, SHIB, and PEPE reflects a bearish bias as meme coins drop below key support levels and broader market conditions grow volatile.
Dogecoin faces a sell-off with bears targeting the next psychological support
Dogecoin is down over 2% at press time on Friday, extending the 6% loss from the previous day. Deep into the fourth consecutive bearish week, Dogecoin has crossed below $0.1200, with bears targeting the $0.1000 psychological support level.
Below this psychological level, the key support zone for DOGE remains between the October 10 low at $0.9500 and the S2 Pivot Point at $0.9172.
The Moving Average Convergence Divergence (MACD) extends below the signal line in the negative territory, while the histogram below the zero line edges wider, confirming downside momentum.
The Relative Strength Index stands at 34, below the midline and nearing oversold, which could slow follow-through but keeps bears in control.
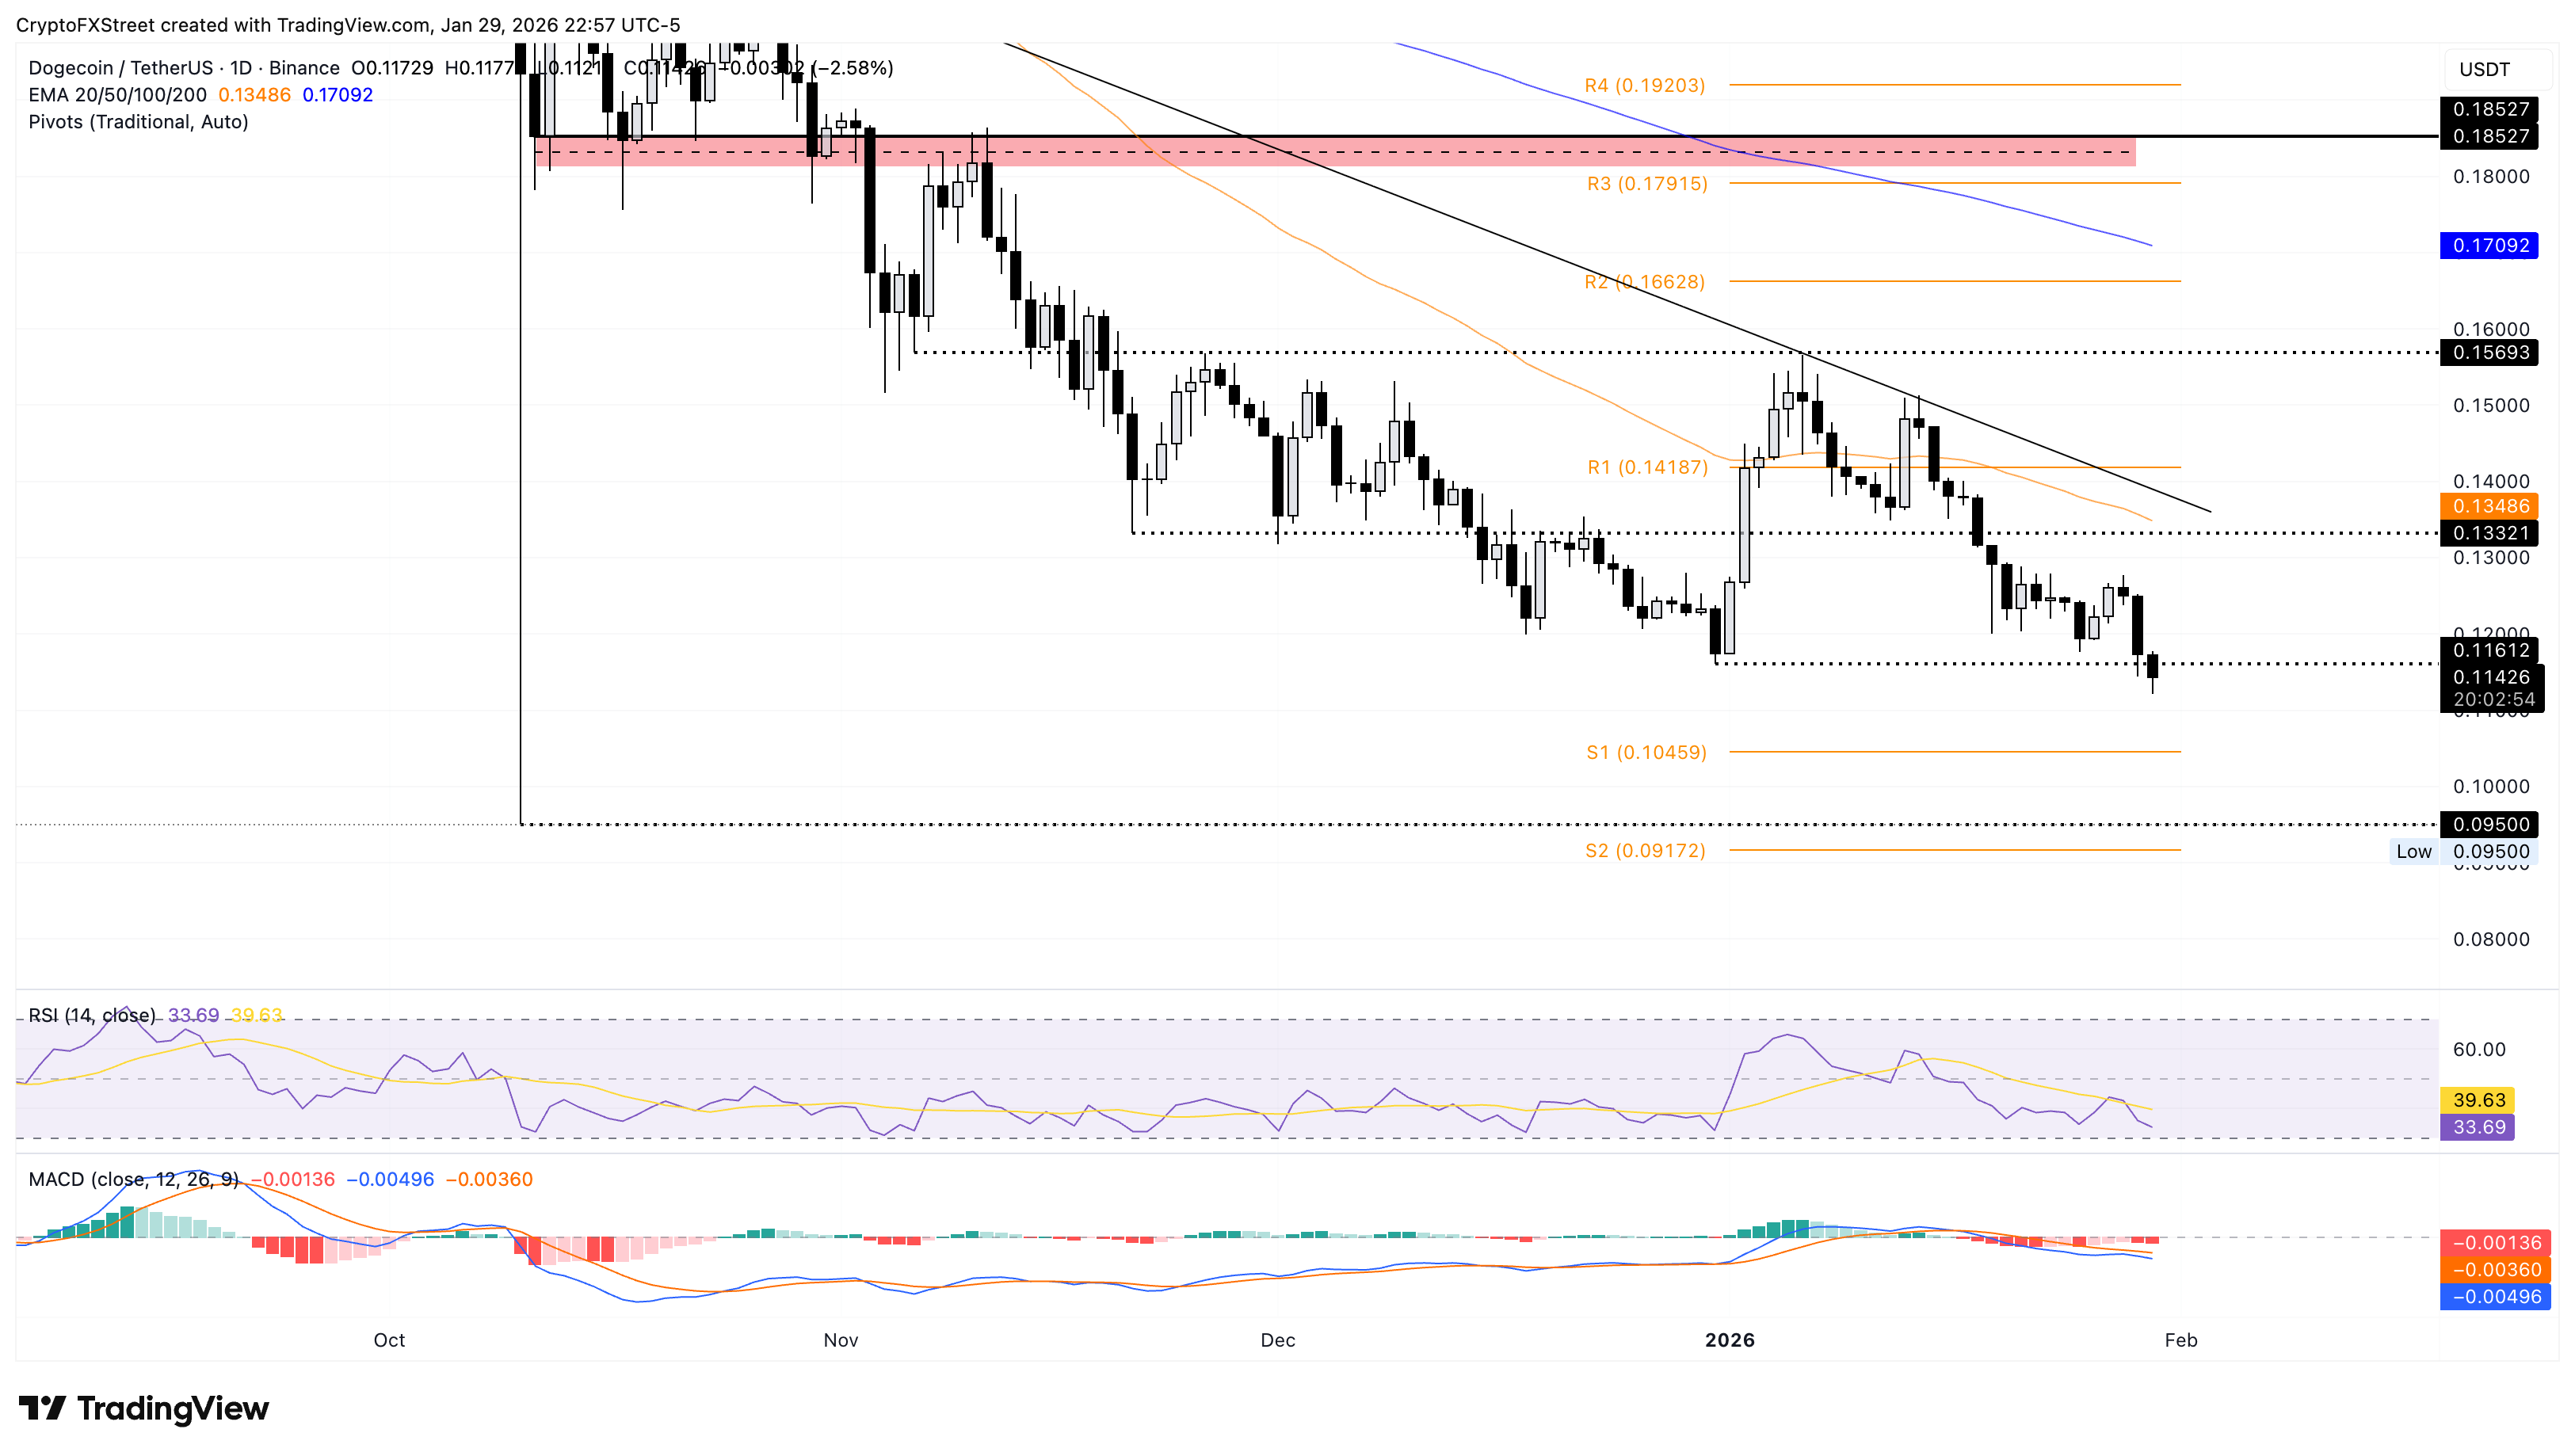
A potential recovery attempt could face resistance at the 50-day EMA at $0.1348.
Shiba Inu extends its downfall as bearish momentum spikes
Shiba Inu remains below the falling 50-day Exponential Moving Average (EMA) and a declining 200-day EMA, with the shorter moving average below the longer one, creating a bearish setup. At the time of writing, SHIB is down 2% on Friday, building on the 5% loss from Thursday.
The MACD and the signal line cross below the zero line as the histogram deepens, indicating a surge in bearish momentum. Meanwhile, the RSI at 36 approaches the oversold zone as selling pressure rises.
Immediate support for SHIB remains at the October 10 low of $0.00000678, followed by the S1 Pivot Point at $0.00000598.
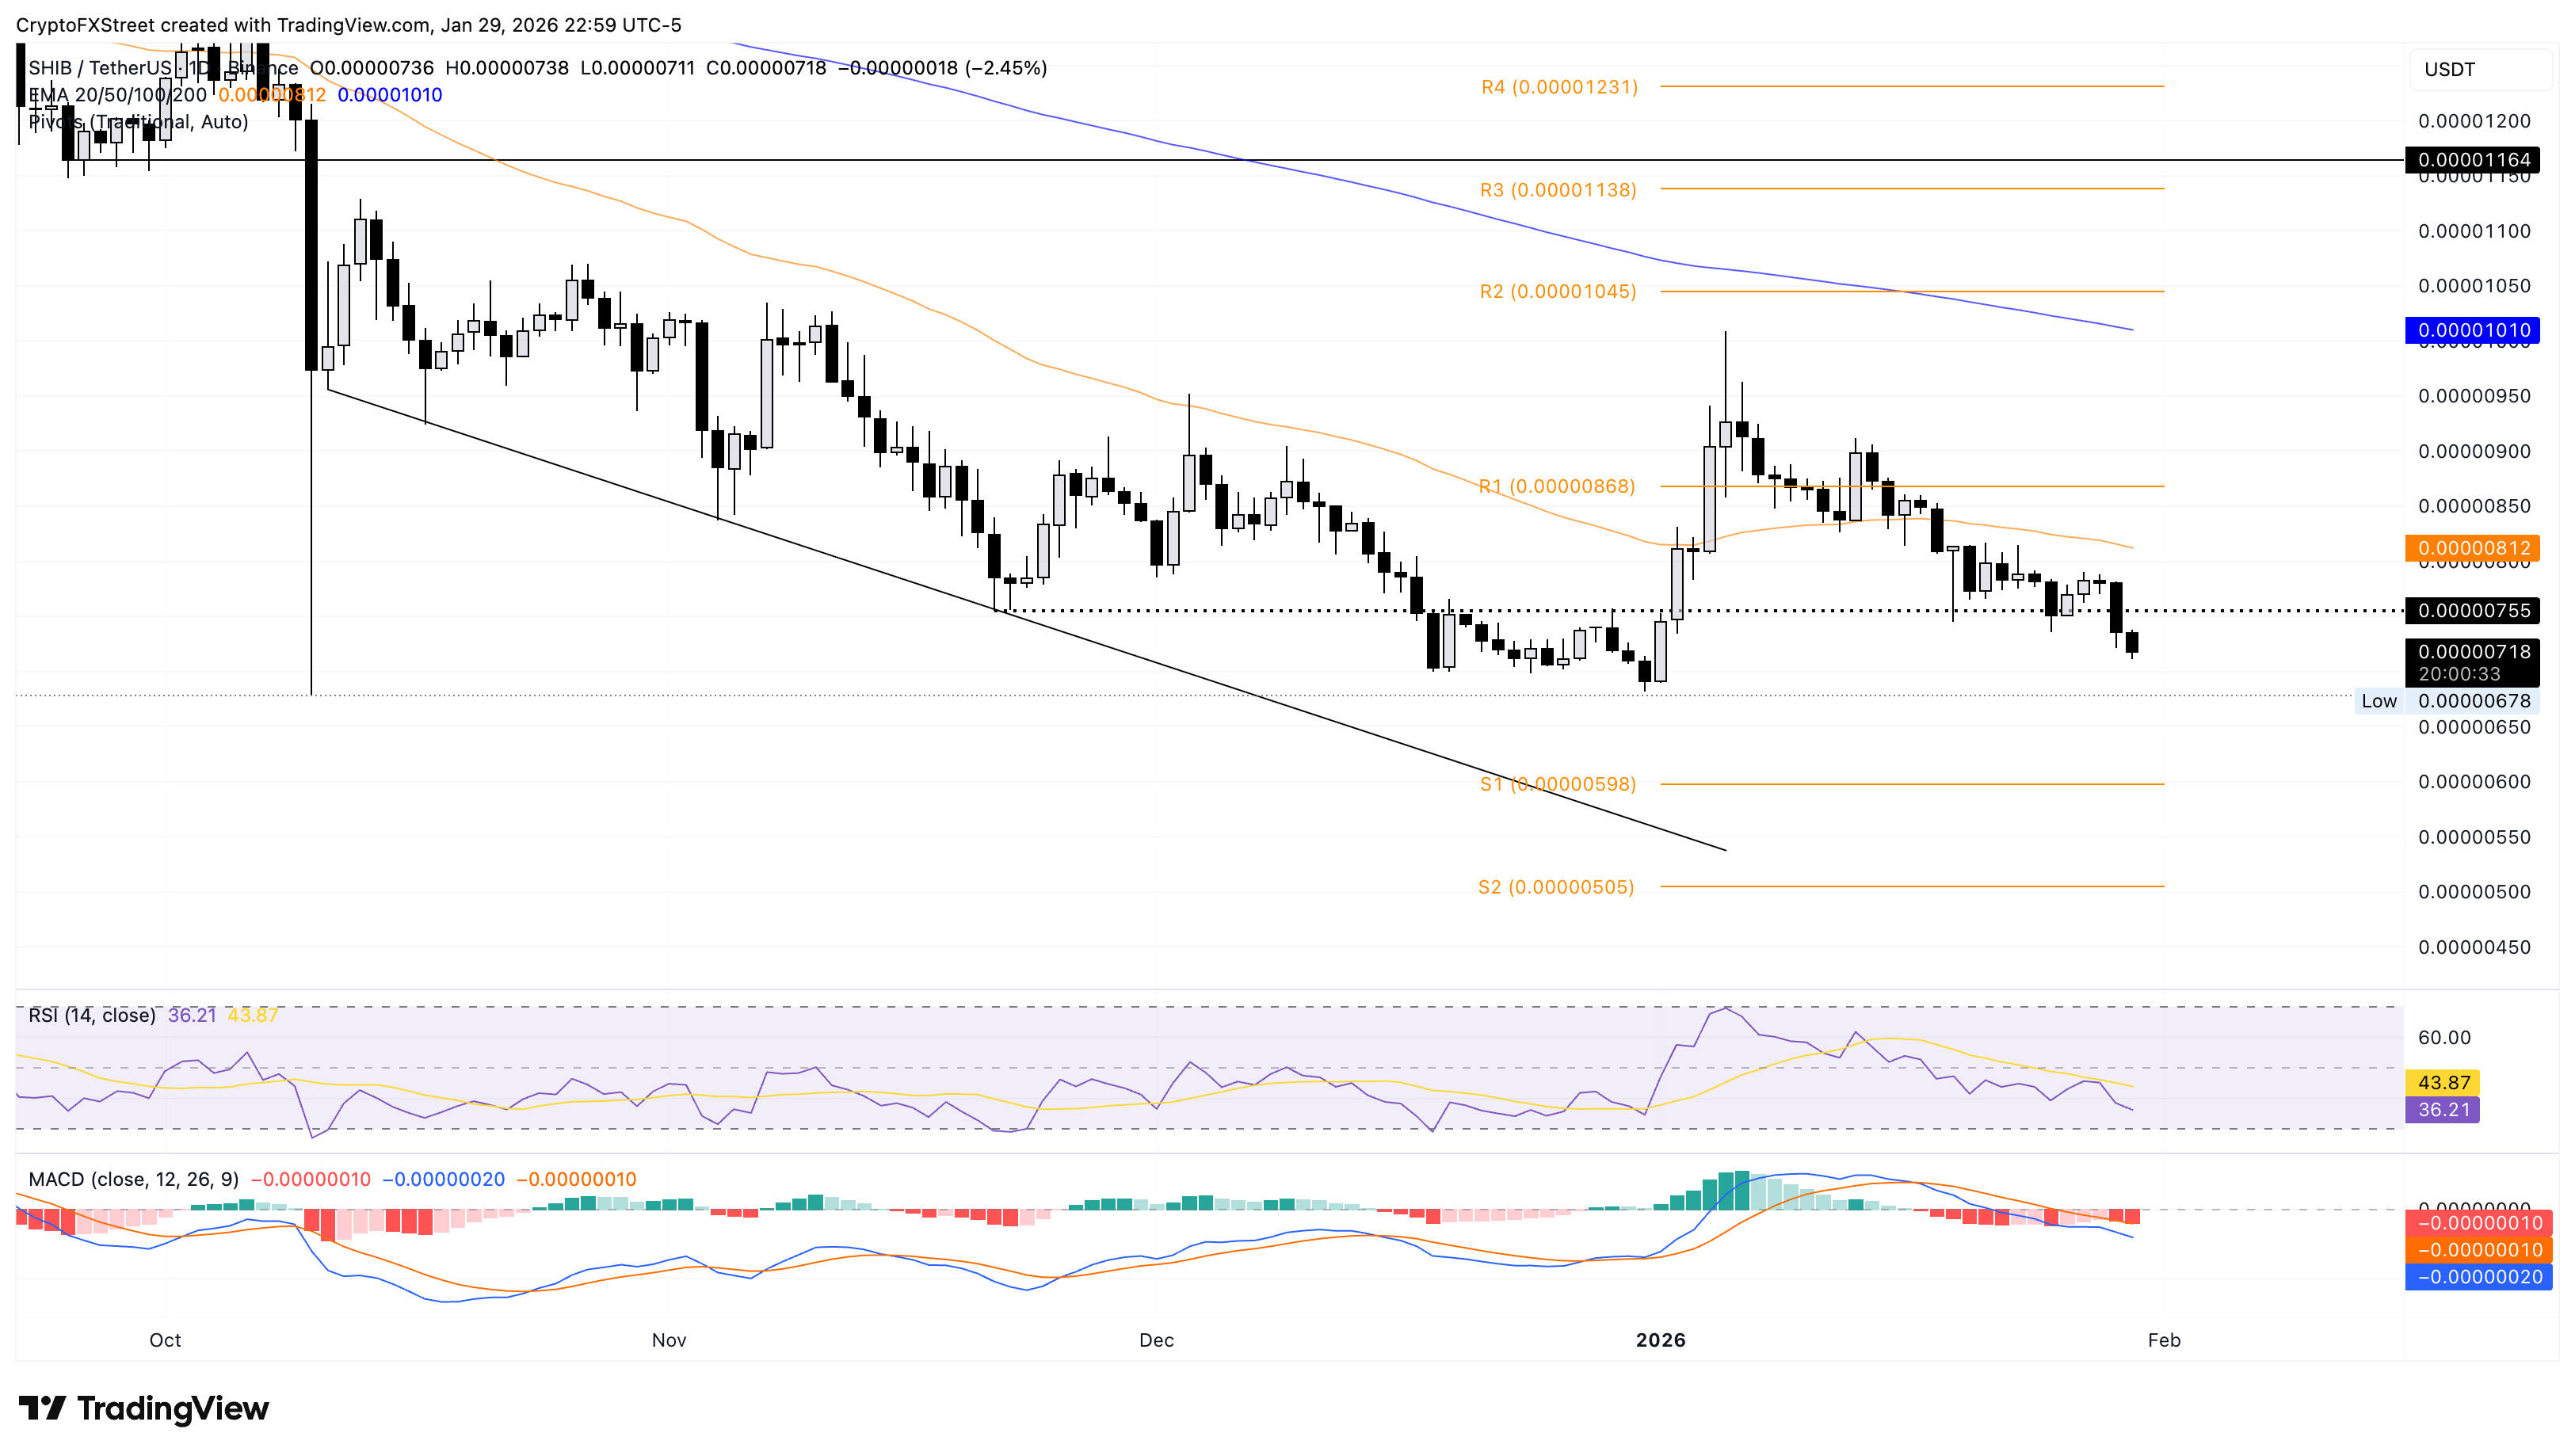
On the upside, a potential recovery in SHIB could face opposition from the 50-day EMA at $0.00000812.
Pepe faces massive downside risk amid intense selling pressure
Similar to other top meme coins, Pepe is down 2% at press time on Friday after a 5% decline on Thursday. The frog-themed meme coin has reversed from its 50-day EMA after three consecutive days of losses. Additionally, the 50-day and 200-day EMAs extend a declining trend, indicating increasing bearish momentum.
Similarly, the momentum indicators on the daily chart indicate that PEPE is under intense selling pressure.
Looking down, the risk is elevated because the nearest support lies at $0.00000363, marked by the December 18 low.
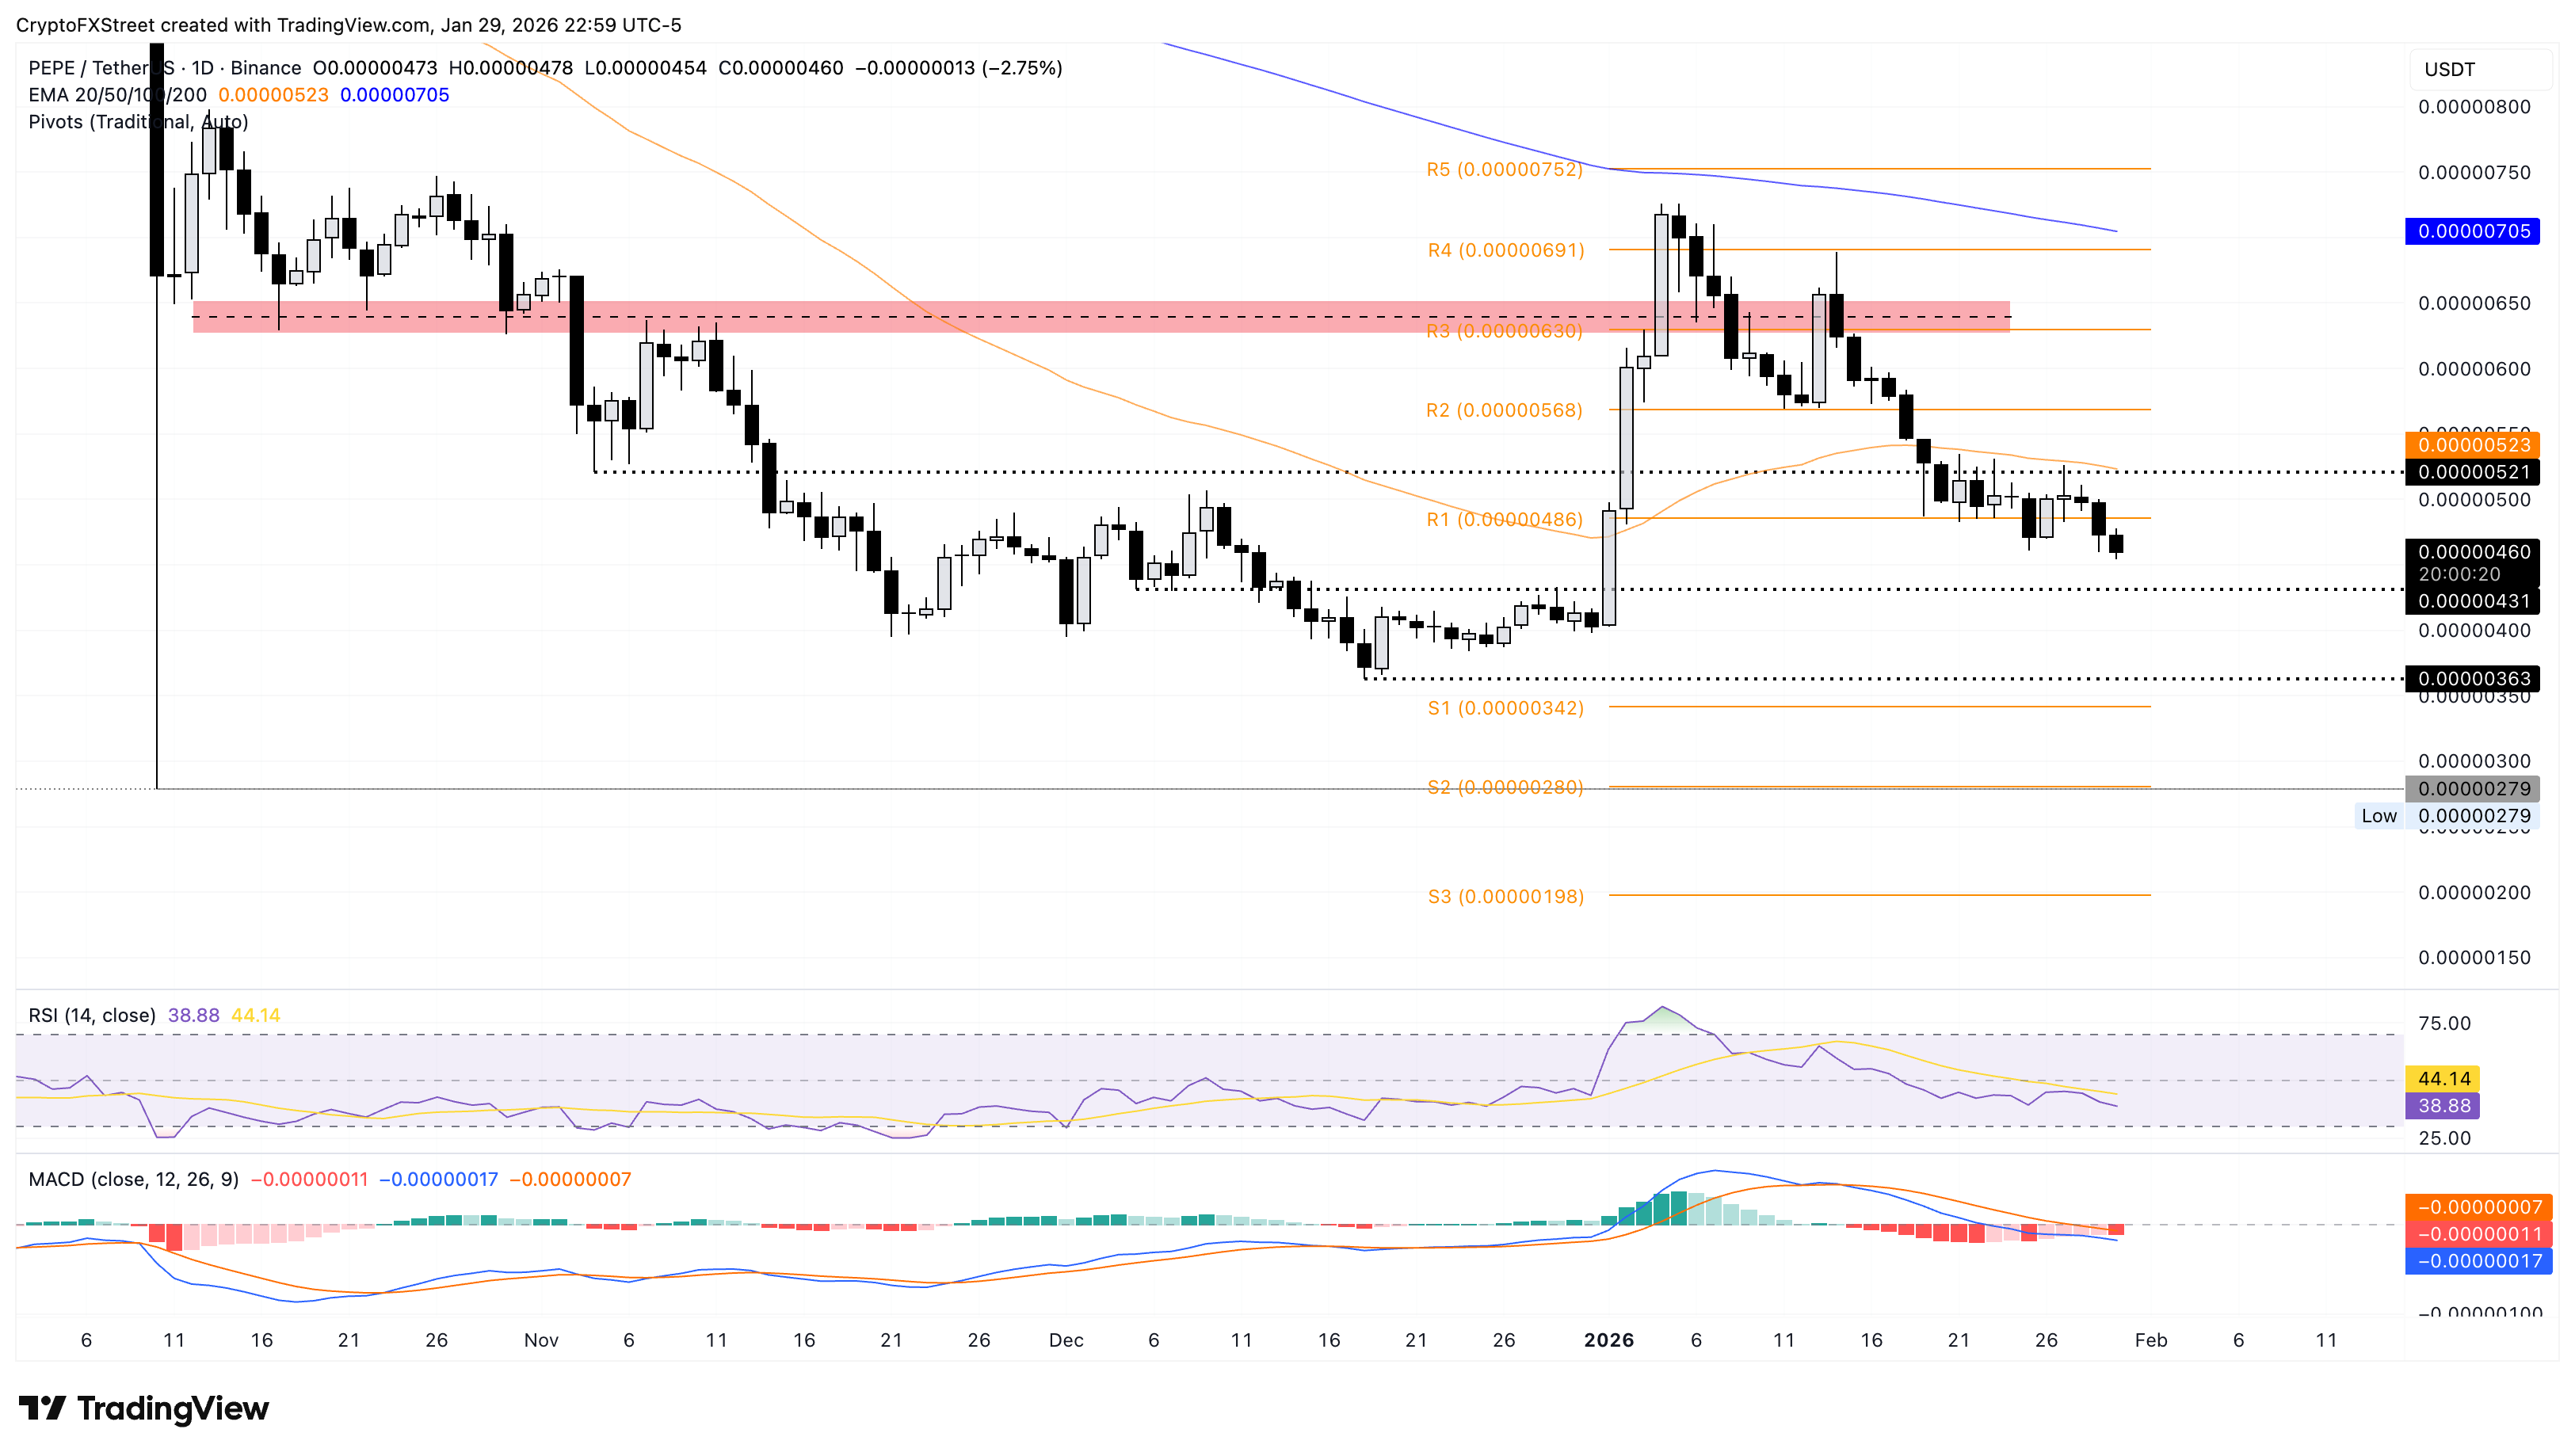
To reinstate an upward trend, PEPE should secure a daily close above the 50-day EMA at $0.00000523.
Author

Vishal Dixit
FXStreet
Vishal Dixit holds a B.Sc. in Chemistry from Wilson College but found his true calling in the world of crypto.



