Meme Coins Price Prediction: Dogecoin, Shiba Inu, Pepe at risk as whales exit
- Dogecoin holds above a crucial moving average as the MACD triggers a sell signal.
- Shiba Inu risks further losses with a breakdown from a triangle pattern.
- Pepe fluctuates at the $0.00001000 psychological level amid an impending Death Cross.

Meme coins, such as Dogecoin (DOGE), Shiba Inu (SHIB), and Pepe (PEPE), are at an increased risk of losses due to the current volatile market conditions. On-chain and derivatives data indicate a decline in interest in DOGE, SHIB, and PEPE, with technicals leaning bearish.
Meme coins at risk as whales count, Open Interest declines
The number of large-wallet investors, commonly referred to as whales, in a meme coin project reflects the underlying strength of its community. A decline in this count indicates a decrease in confidence among large investors.
Santiment data shows a decline in DOGE whales, with investors owning more than 10 million tokens dropping to 882 from 887 on Monday. The decrease in SHIB whales reaches 377K, down from the monthly high of 380.48K.
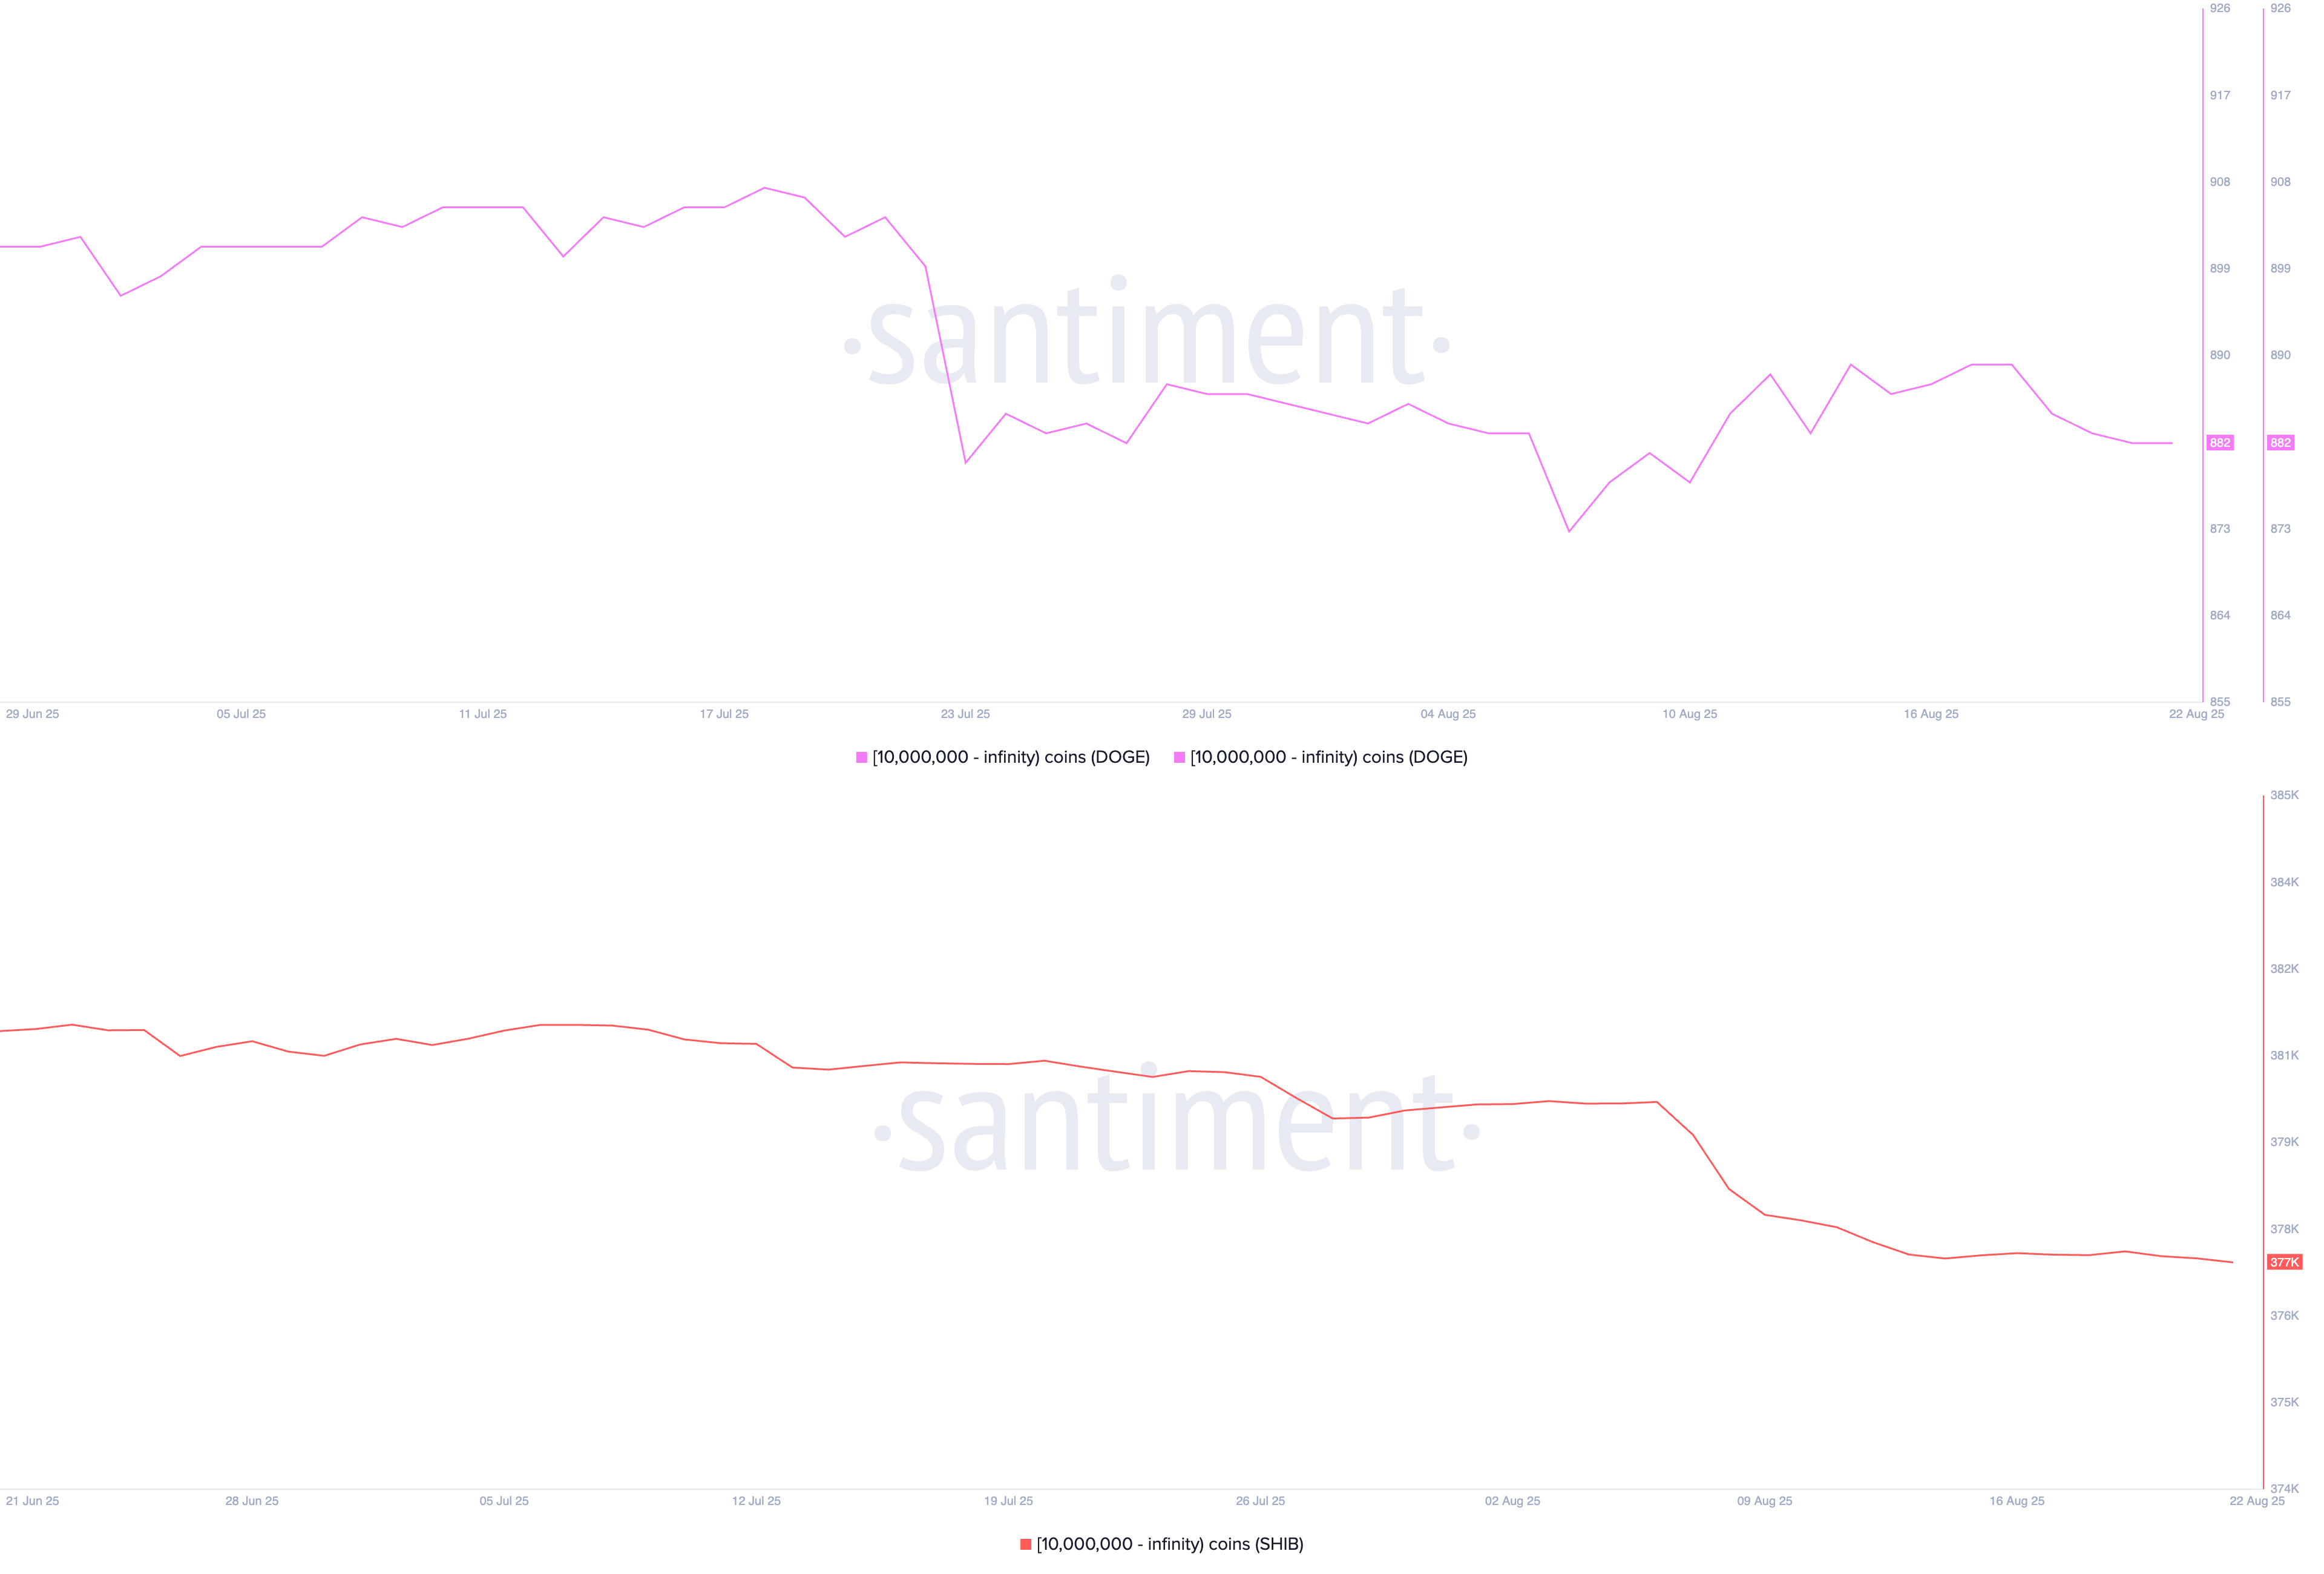
DOGE, SHIB Supply Distribution. Source: Santiment
Similarly, the count of PEPE whales is at 173K, down from the 30-day high of 173.57K.
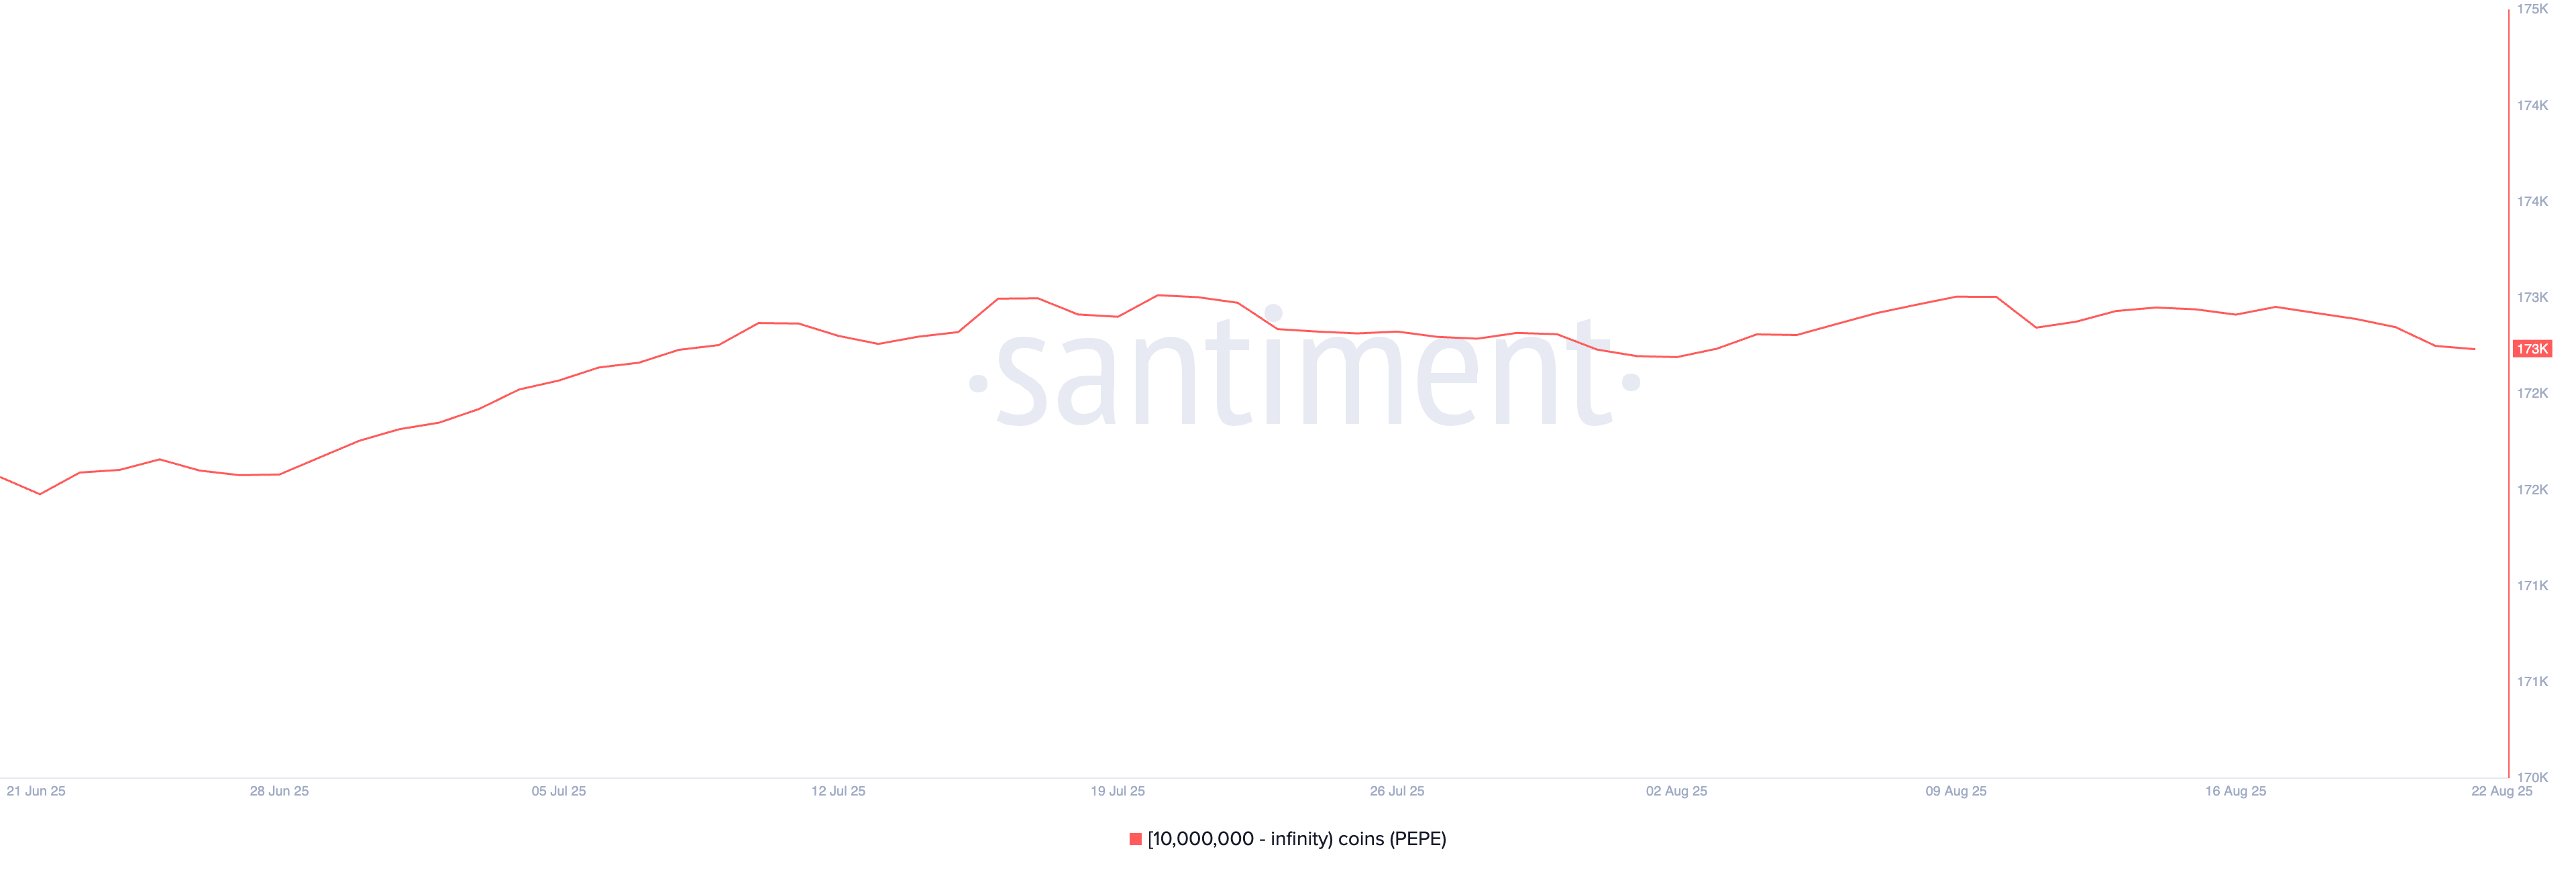
PEPE Supply Distribution. Source: Santiment
The soft conviction among whales aligns with a decline in Open Interest (OI) for meme coins in the derivatives market. CoinGlass data shows that the OI of DOGE, SHIB, and PEPE has decreased by over 2% in the last 24 hours. A decline in OI refers to heightened capital outflows as risk-off sentiment intensifies.
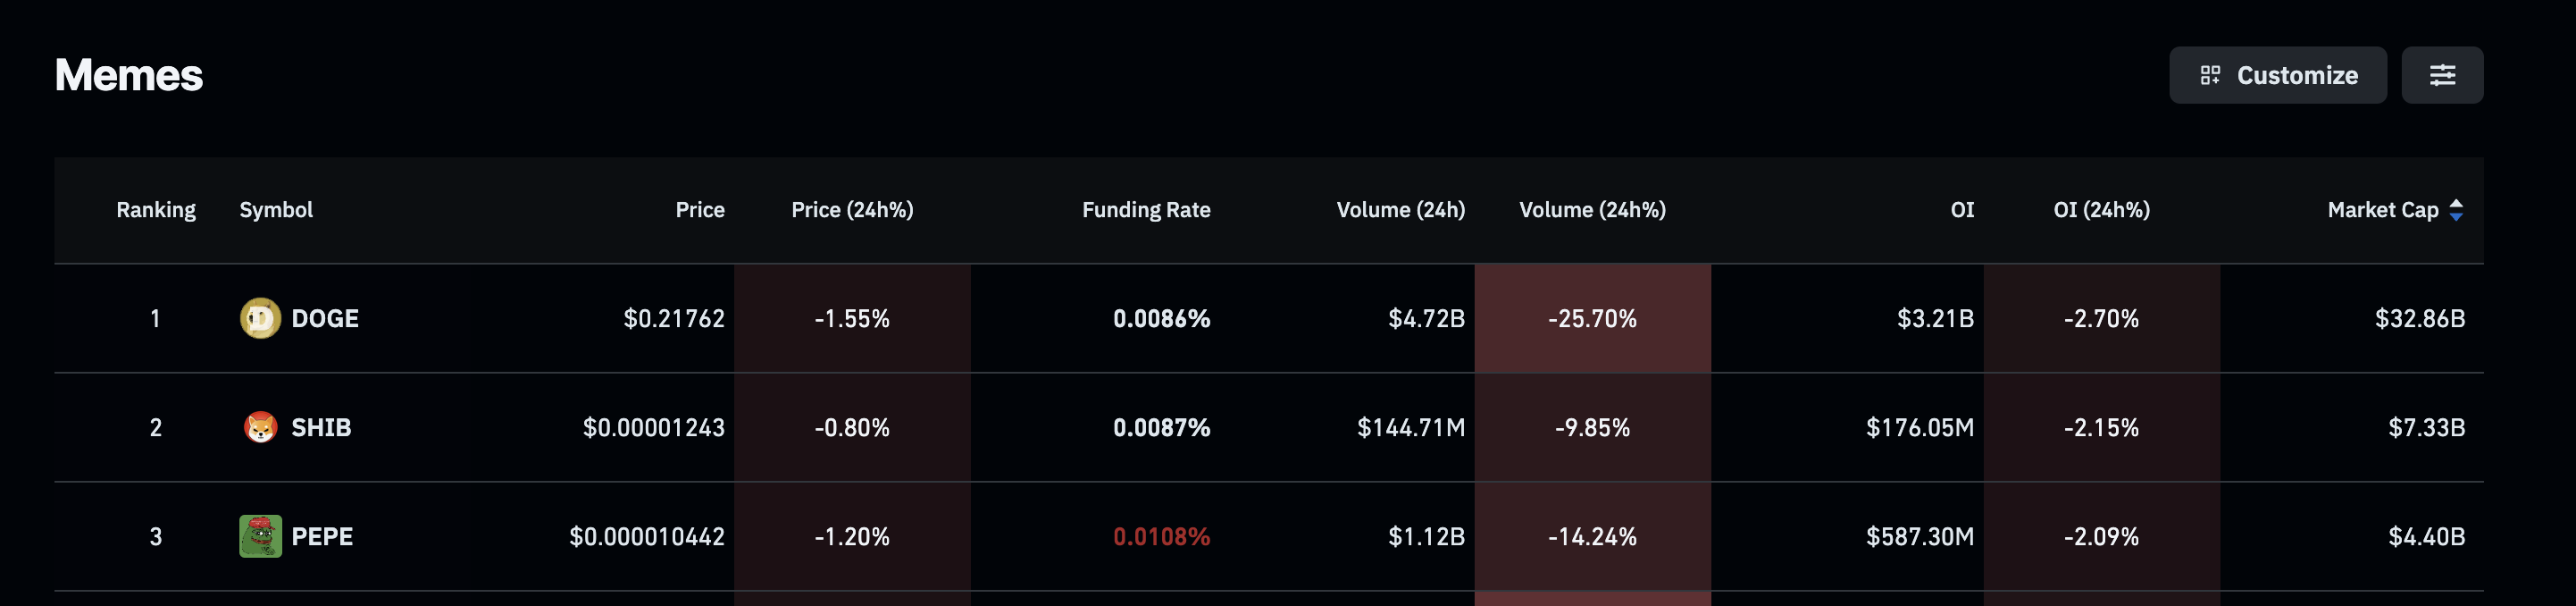
Meme coins Open Interest. Source: Coinglass
Dogecoin risks losing the 200-day EMA
Dogecoin trades at $0.2180 at press time on Friday, holding above the 50-day Exponential Moving Average (EMA) at $0.2156. The largest meme coin by market capitalization, at $32.80 billion, is at risk of losing its support from the 50-day EMA, followed by the 100-day and 200-day EMAs, as it prepares for a Golden Cross if whales count and Open Interest continues to decline.
A drop below the 100-day EMA at $0.2092 could send DOGE to the $0.1884 low from August 3.
The Relative Strength Index (RSI) on the daily chart reads 48 as it hovers below the halfway line, with further room for correction.
The Moving Average Convergence Divergence (MACD) and its signal line are on a downward slope, edging closer to the zero line. A slip into the negative territory would flash a bearish shift in trend momentum, indicating a sell opportunity for sidelined investors.
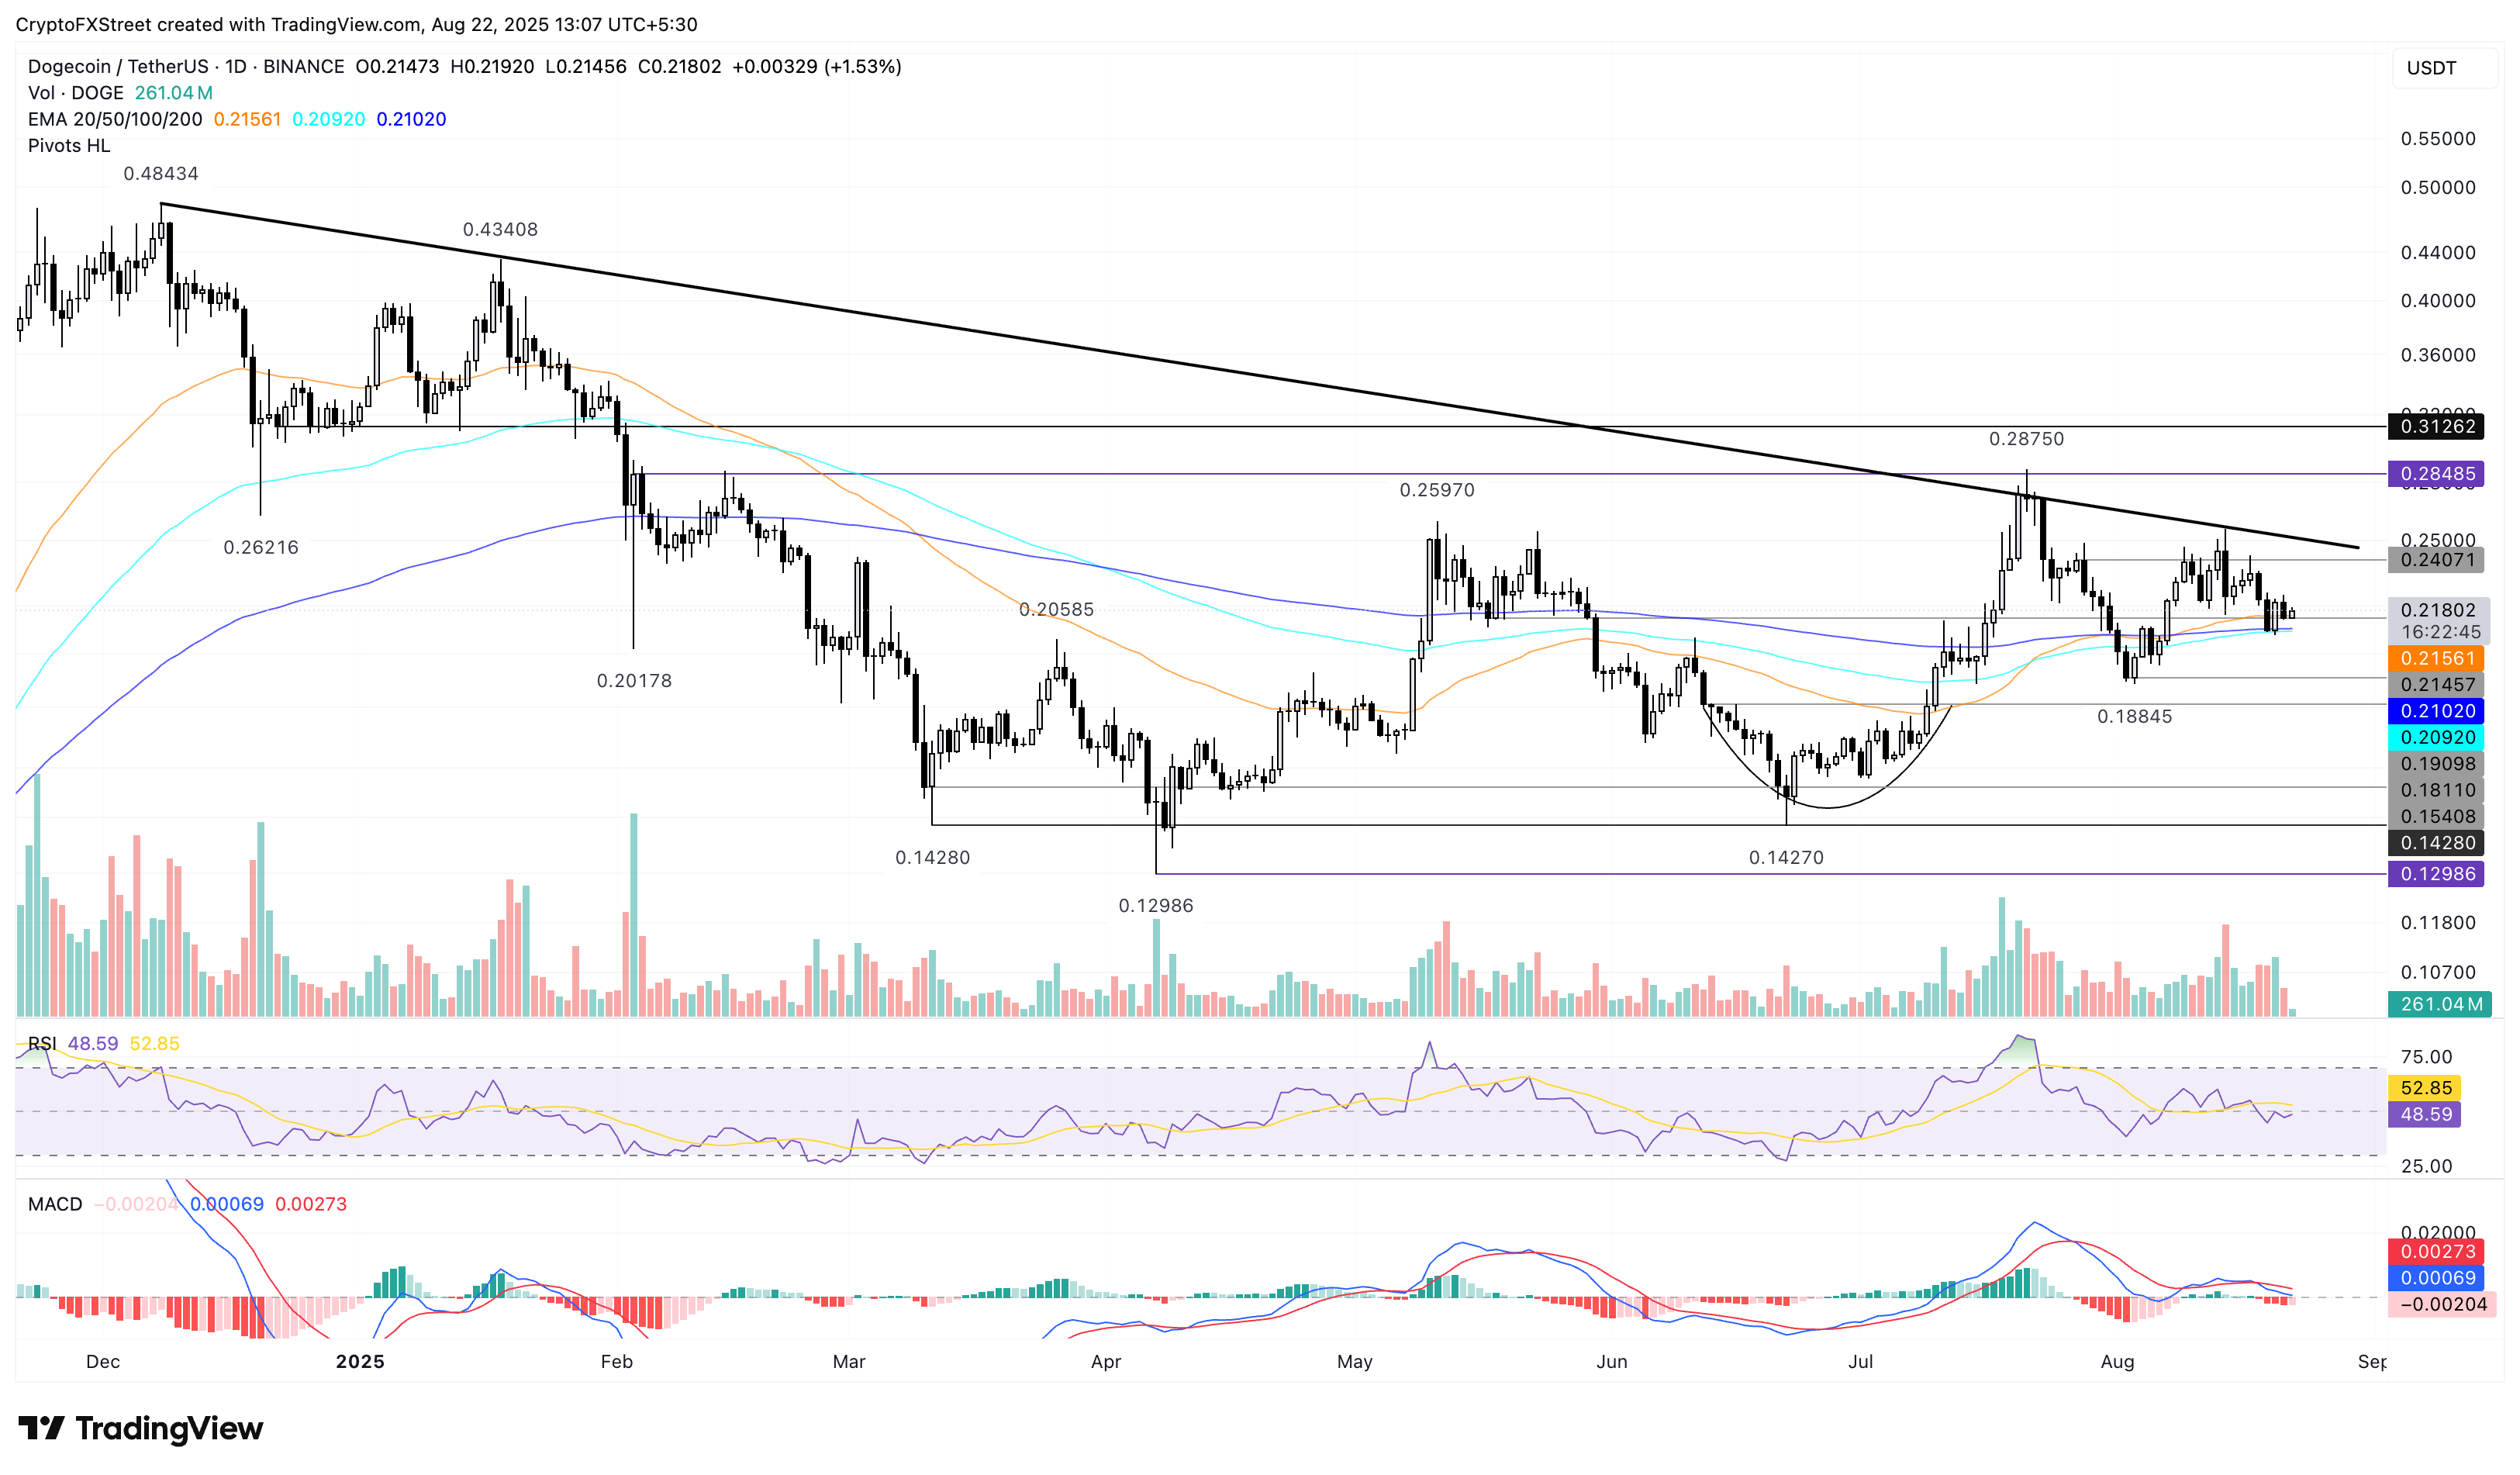
DOGE/USDT daily price chart.
On the upside, a potential bounce-back in DOGE could test an overhead resistance trendline at $0.2500, formed by connecting the peaks of December 8 and January 18.
Shiba Inu risks further losses
Shiba Inu holds above $0.00001244 at press time on Friday, following the 1.59% drop from Thursday. The meme coin risks further losses to the $0.00001160 low from August 2 if the support levels are breached.
The momentum indicators suggest a bearish outlook on the daily chart as the MACD and signal lines cross into the negative territory, and the RSI at 44 slopes downwards.
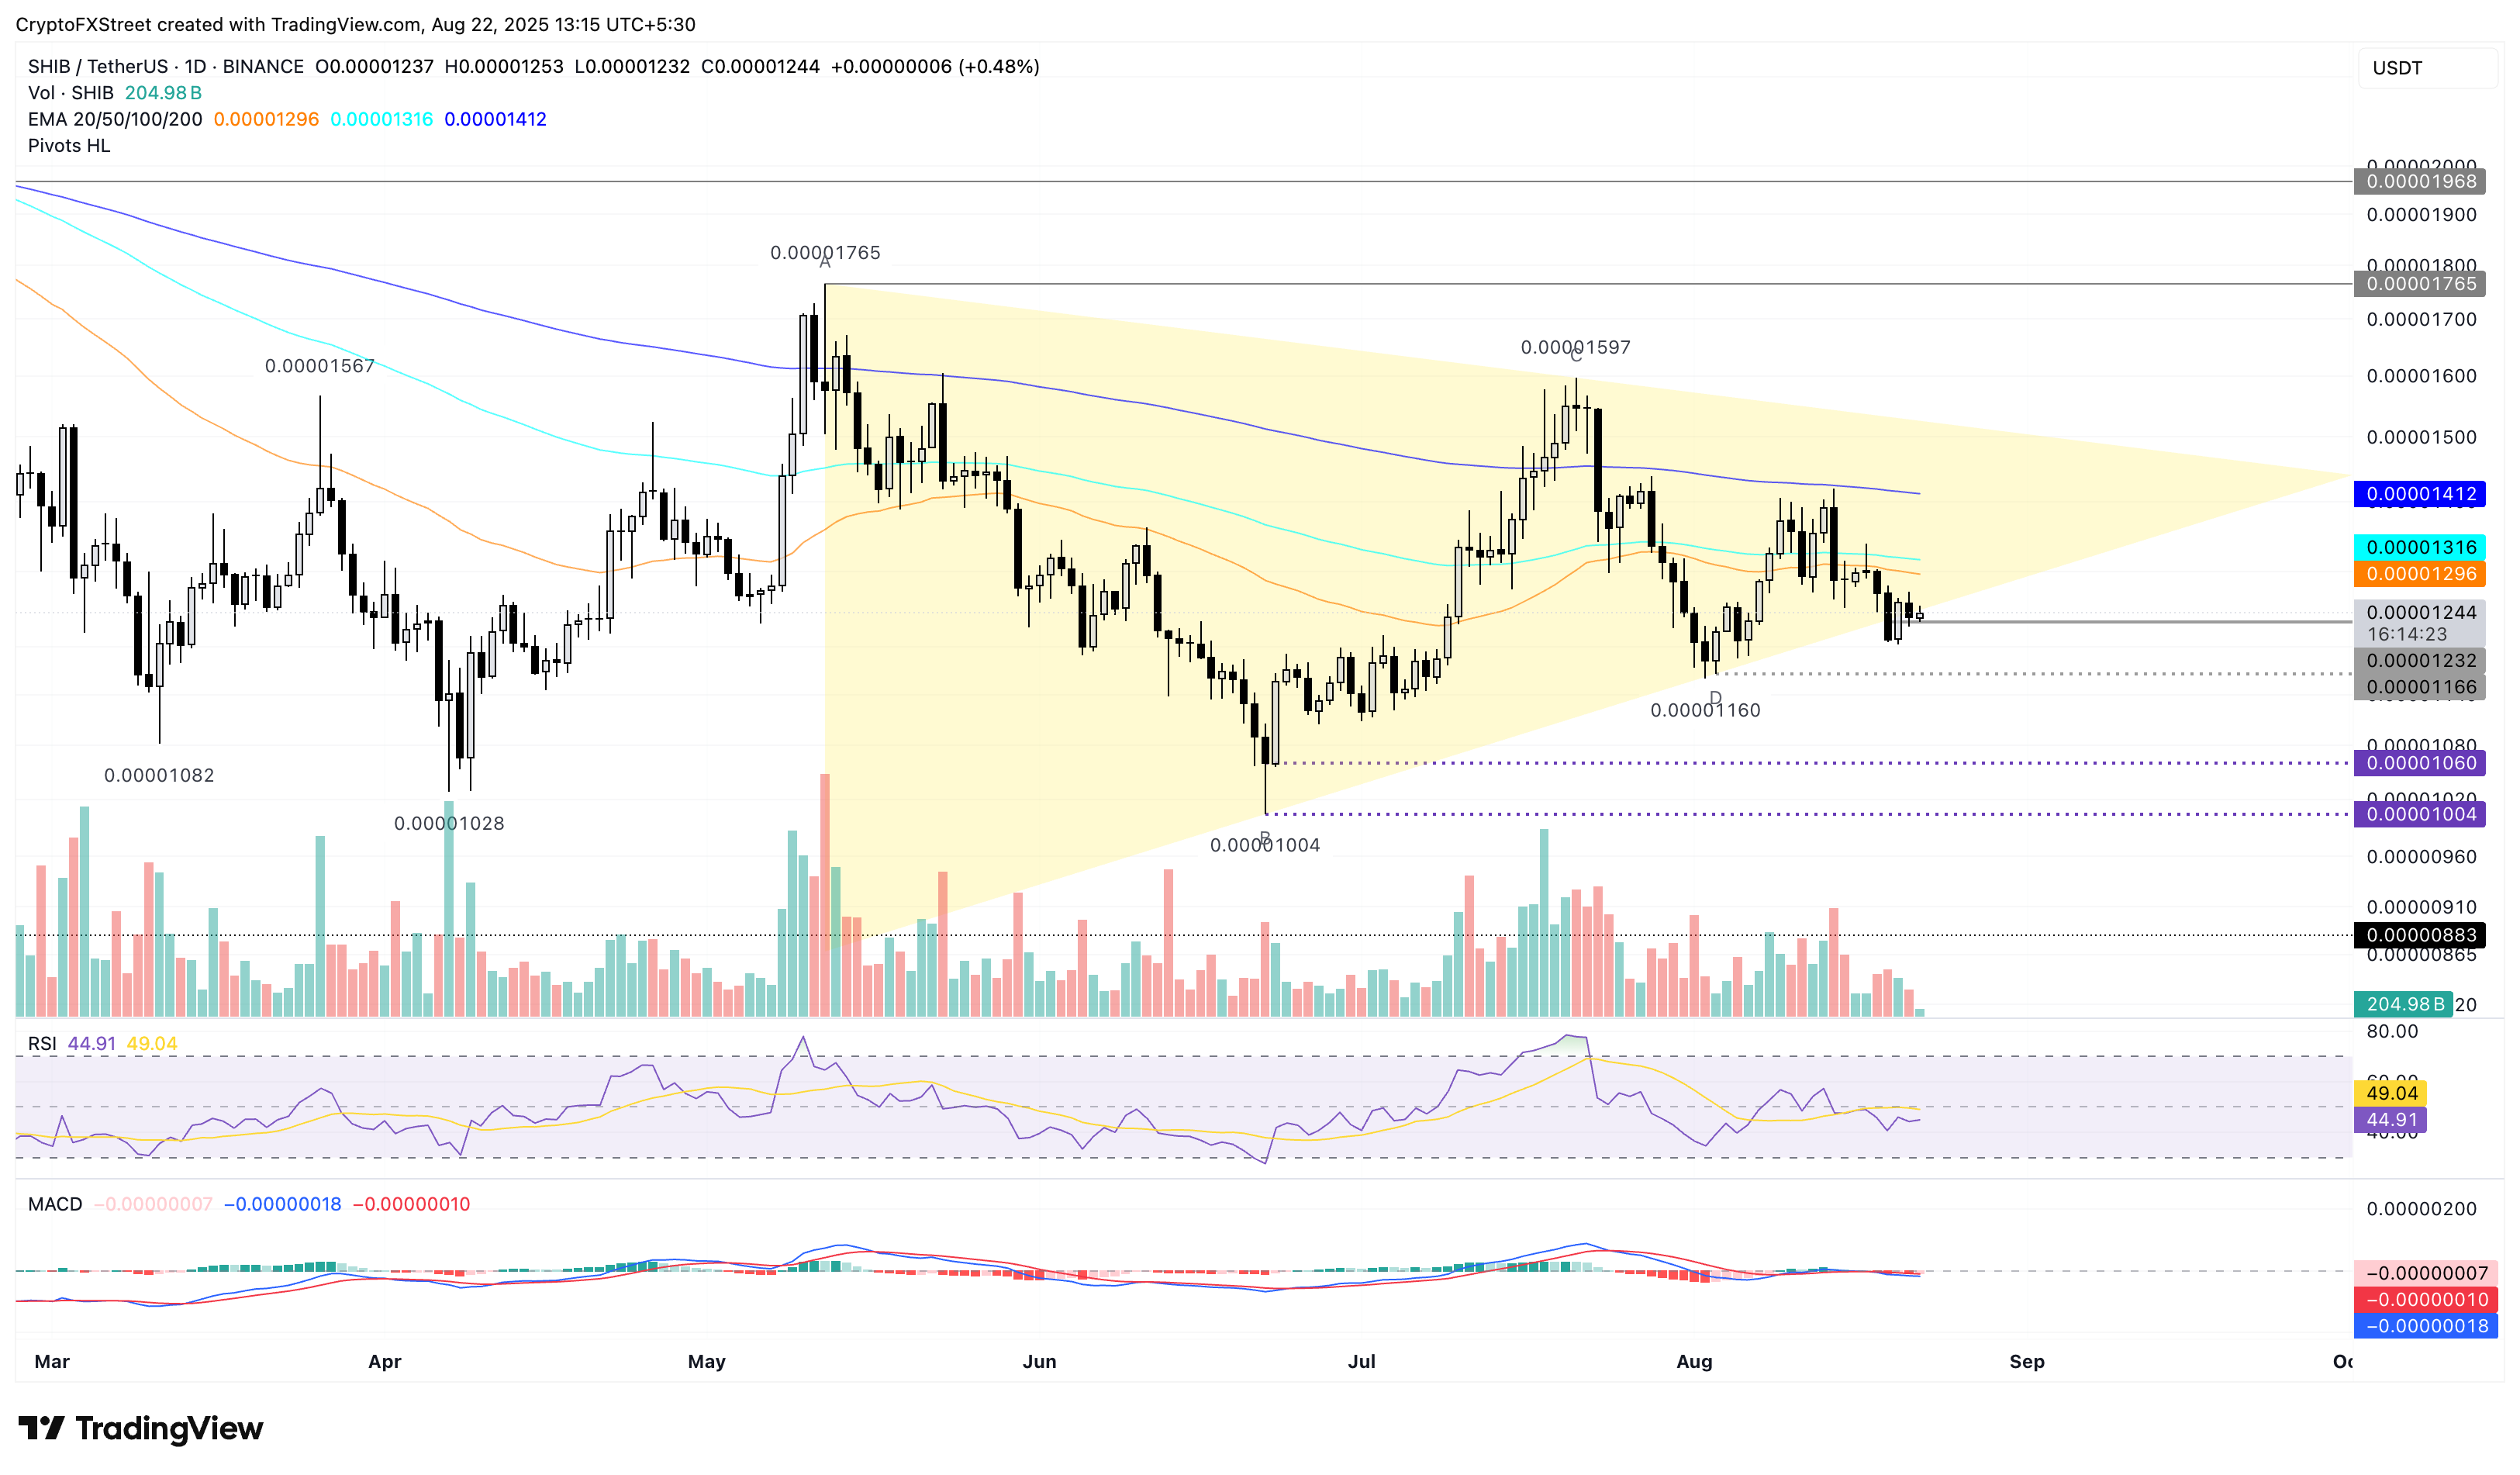
SHIB/USDT daily price chart.
On the flip side, a potential bounce back from the $0.00001244 support level could test the 50-day EMA at $0.00001296.
Pepe’s last hold at a crucial psychological level
Pepe extends the declining trend following the breakdown of a symmetrical triangle on the daily chart. At the time of writing, the frog-themed meme coin trades at $0.00001044, holding above the $0.00001000 psychological level.
The downside risk escalates as the declining 50-day EMA risks a Death Cross pattern, with the close moving 100-day and 200-day EMAs. A potential crossover would signal a sell signal as bearish influence grows over the short-term trend.
The MACD and its signal line maintain a steep trend with the RSI at 43 below the midpoint line, indicating a bearish tilt.
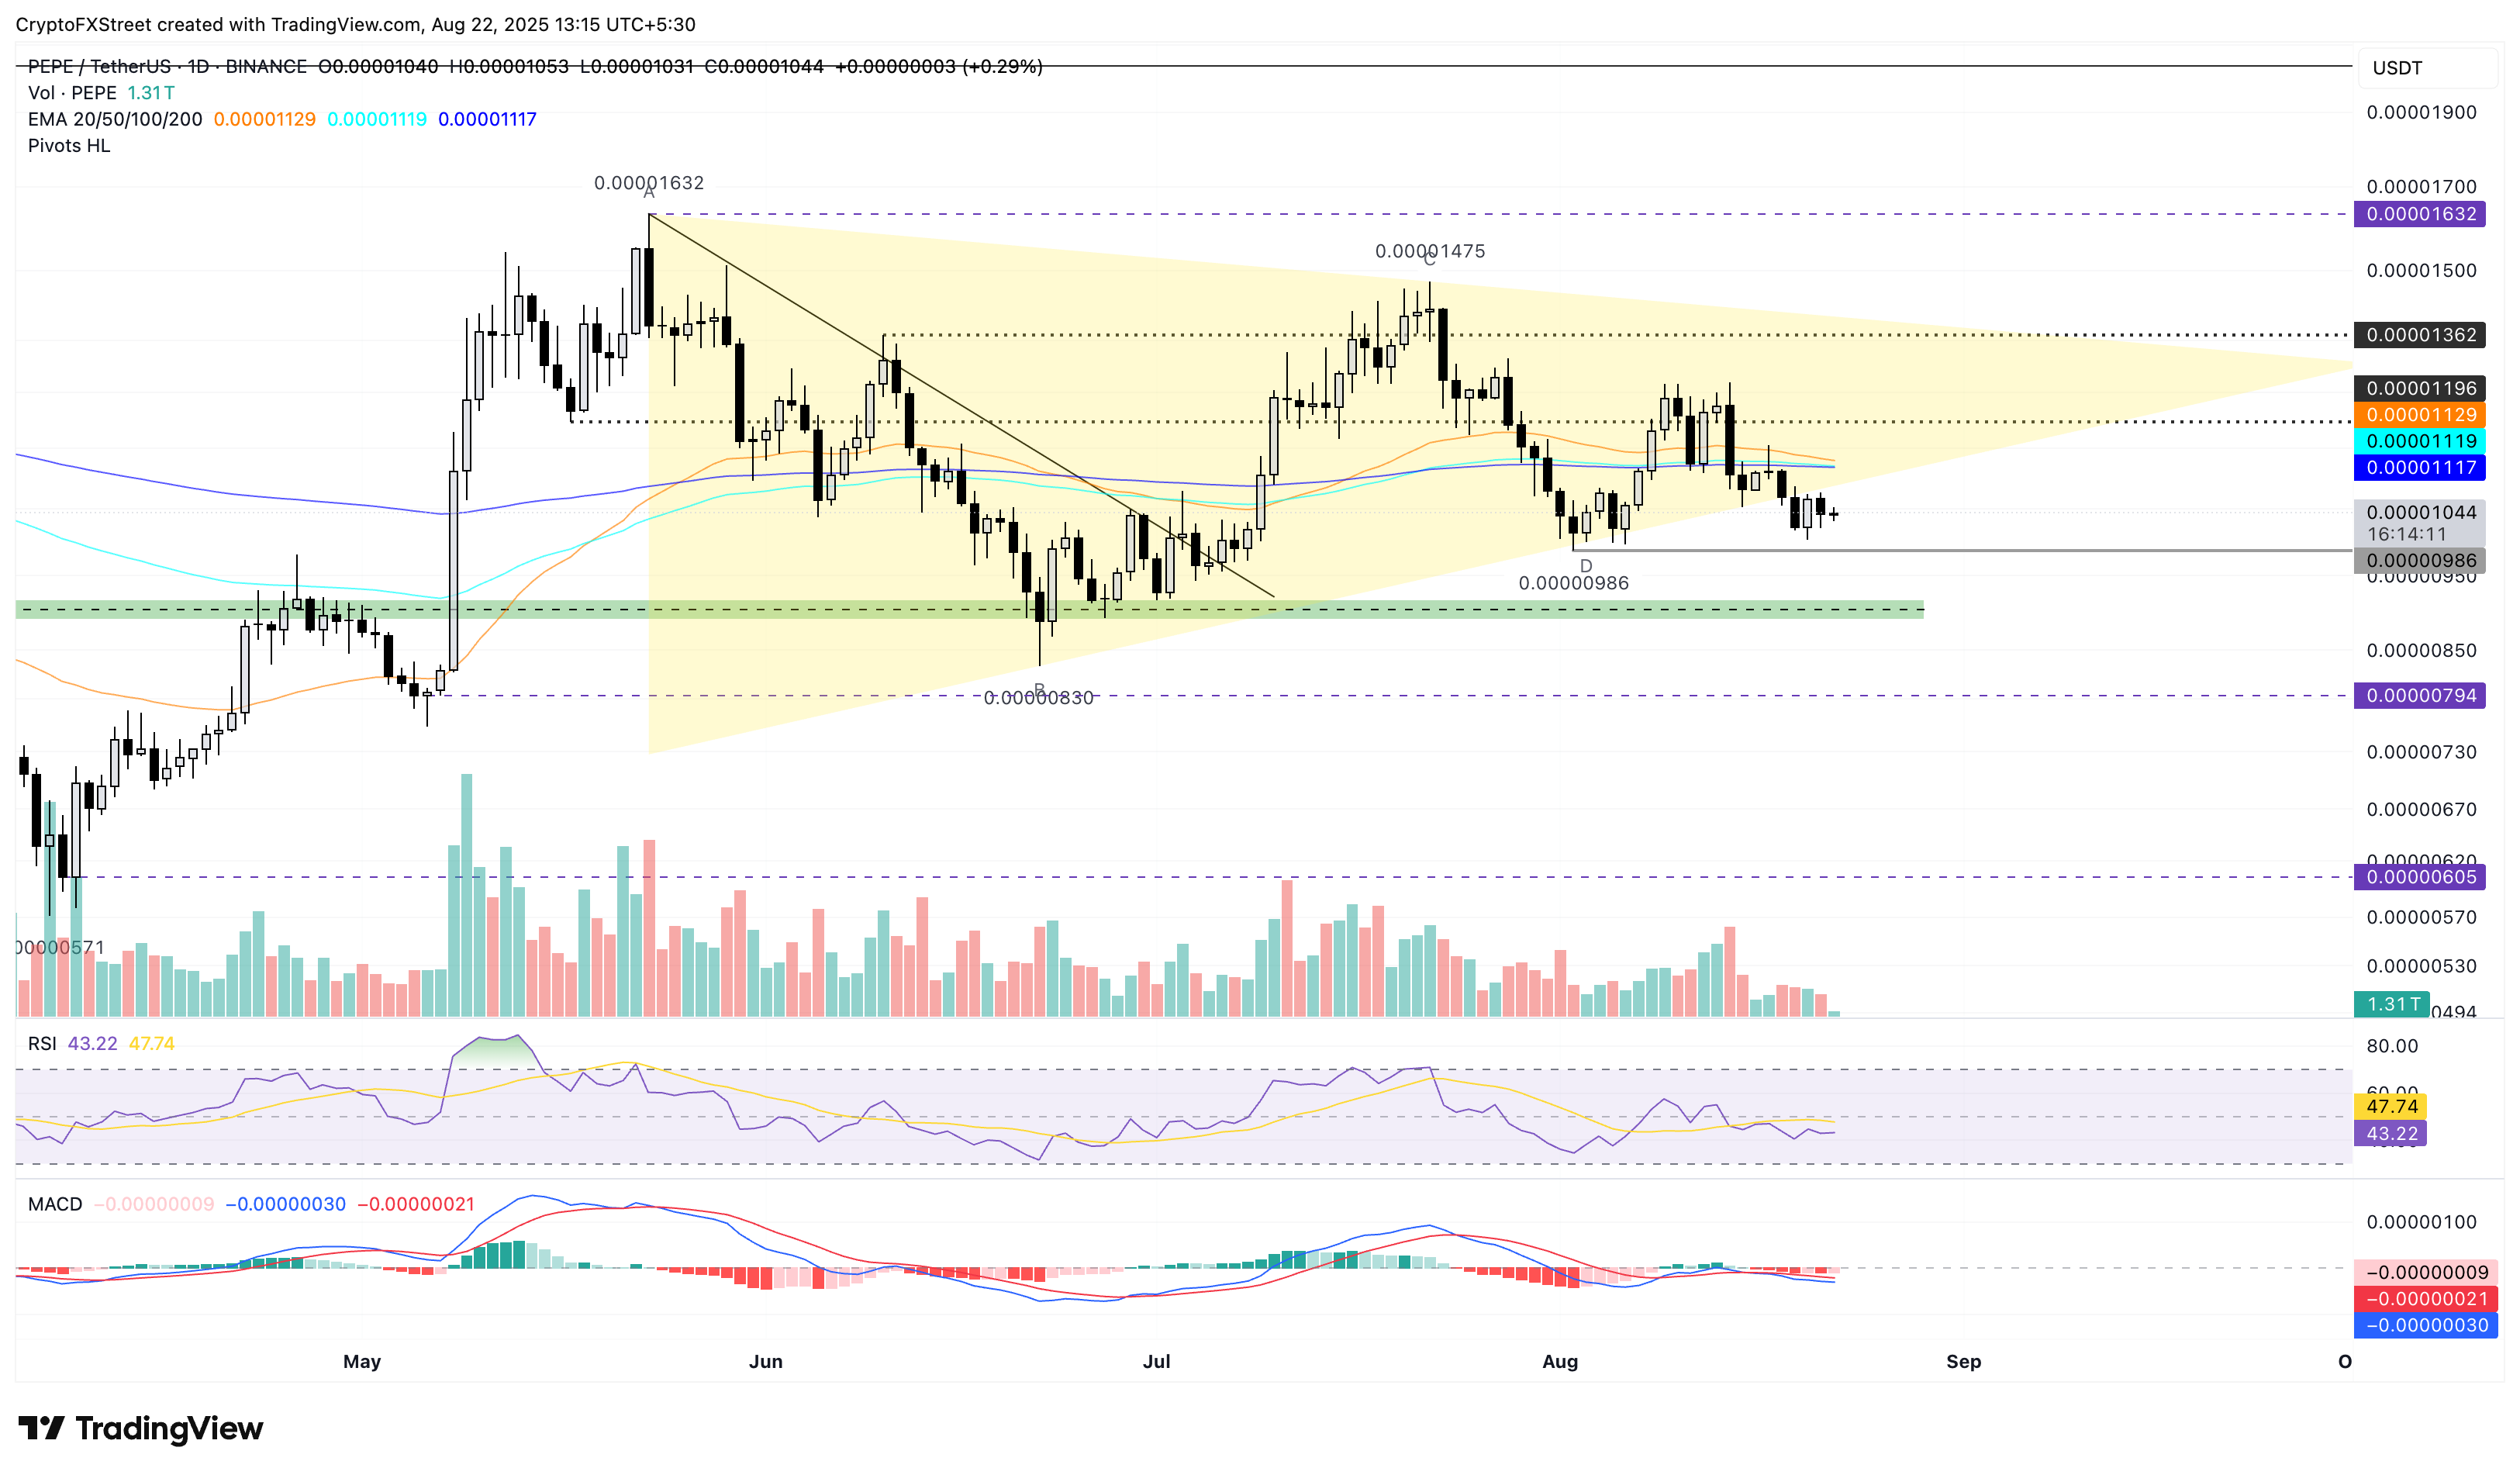
PEPE/USDT daily price chart.
On the contrary, a potential reversal in PEPE could test the 200-day EMA at $0.00001117.
Author

Vishal Dixit
FXStreet
Vishal Dixit holds a B.Sc. in Chemistry from Wilson College but found his true calling in the world of crypto.


