MATIC price risks a 7% fall even as the network empowers the next wave of DeFi on Polygon zkEVM
- Polygon price faced a rejection from the $0.9702 resistance to hold thinly above the 50-day SMA at $0.8599.
- MATIC could drop 7% to the $0.8000 psychological level, with the buck resting on the 50 SMA.
- The bearish thesis will be invalidated if the price flips $0.9702 into support for a chance to test the supply zone.

Polygon (MATIC) price is trading with a bearish bias, drenched just like the rest of the market as cryptocurrencies bleed. The dump is instigated by Bitcoin, whose price is on the cliff steered by Grayscale Bitcoin Trust (GBTC) redemptions whose holders are seizing the opportunity to sell after years.
Also Read: Polygon’s MATIC swept off exchanges in large volumes, token eyes recovery
Polygon zkEVM empowers the next wave of DeFi
The Polygon network has embarked on a commitment to empowering the next wave of decentralized finance (DeFi). With this, it introduces the zkBuilder Decentralized Grants Program that will “support, fund, and bootstrap DeFi builders on Polygon zkEVM.” Specifically, developers are equipped to thrive in the ecosystem.
Empowering the next wave of DeFi on Polygon zkEVM.
— Polygon (Labs) (@0xPolygonLabs) January 13, 2024
Introducing the zkBuilder Decentralized Grants Program, designed to support, fund, and bootstrap DeFi builders on Polygon zkEVM.
As Polygon zkEVM gears up for the next phase of growth in March, it’s important developers are… pic.twitter.com/miCt1fRiPa
Polygon zkEVM delivers enhanced levels of security and uptime. It is in the second stage, which is focused on responsible decentralized application (DApp) growth and activation of activity onchain. Stage one of the Polygon zkEVM Mainnet Beta has lasted the last ten months, focused on testing, scaling and growing the infrastructure.
Polygon price outlook
Polygon price is sitting on the support provided by the 50-day Simple Moving Average (SMA) at $0.8599, as bulls try to establish dominance in the MATIC market. The histogram bars of the Awesome Oscillator (AO) are flashing green pushing towards the positive territory, evidence of bulls mounting a recovery.
If the 50-day SMA holds as support, therefore, Polygon price could recover north, extending past the $0.9000 psychological level. In a highly bullish case, the gains could extend for the MATIC price to tag the $0.9702 blockade. While a break above this resistance level would be ideal, the extension north will only be confirmed once the price forays in the supply zone extending from $0.9833 to $1.0400. A decisive candlestick close above its midline of $1.0116 would confirm the continuation of the uptrend.
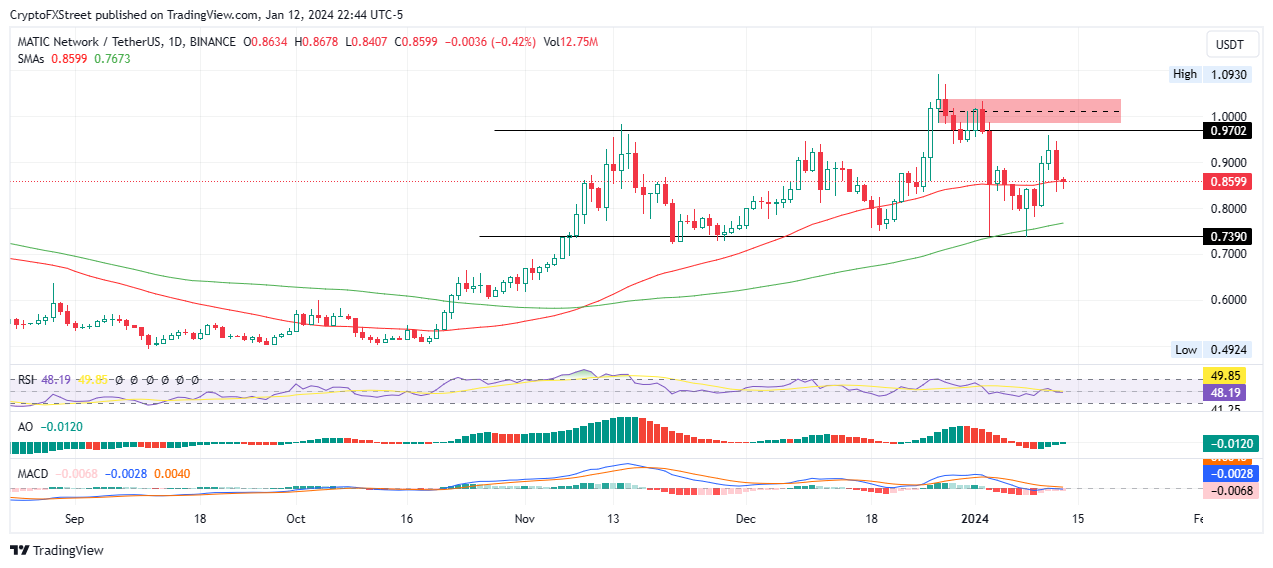
MATIC/USDT 1-day chart
Conversely, if the sellers overpower the bulls, Polygon price could slip past the 50-day SMA at $0.8599, potentially extending the fall to the $0.8000 psychological level, standing 7% below the current price. In the dire case, the fall could see MATIC price extend a leg south to the 100-day SMA at $0.7673. Such a move would denote a 15% fall below current levels.
This thesis is also a possibility, considering the position of the Relative Strength Index (RSI) below the 50 midline. The Moving Average Convergence Divergence (MACD) is also in the negative territory, moving below the signal line (orange band) after crossing below it on January 3.
Author

Lockridge Okoth
FXStreet
Lockridge is a believer in the transformative power of crypto and the blockchain industry.


