|

MATIC price reroutes south as bears lock in on $1.15

  • MATIC price is failing to hold support on the 4-hour chart.
  • Polygon price rejected the 50-day moving average  
  • Invalidation to the bearish scenario is a close above $1.56.

MATIC price is experiencing a strong selloff this Tuesday. There may have been early signs forecasting the move.

MATIC price looks fully controlled by the bears

MATIC price is declining this Tuesday as the bears flex their power on the 4-hour Chart. At the current time, the MATIC price trades at $1.27. Traders are likely to see a sweep the lows event in the next few hours as the bears are confidently charging towards the $1.15 target zone mentioned in this month’s bearish thesis.

MATIC price issued a few warnings for the current selloff. The most significant sell signal may have been the rejection of the 50-day moving average at $1.50 on April 22nd. The bearish rejection could justify a $1.15 price target and the sudden decline displayed in the current MATIC price action.
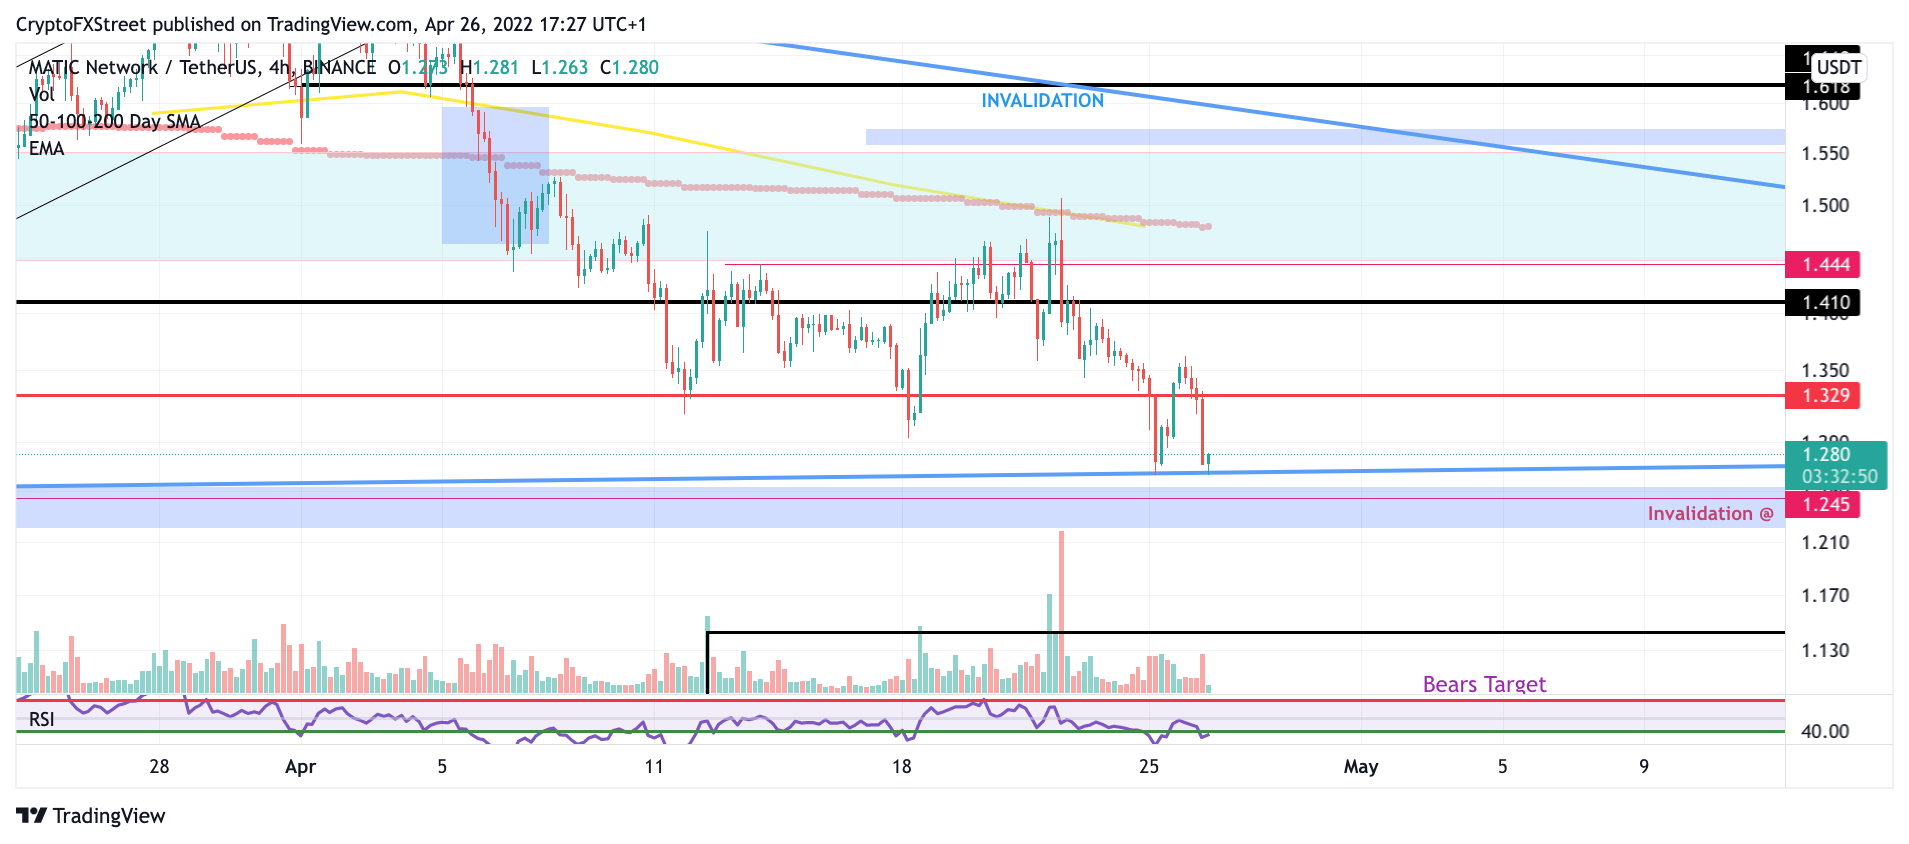
TM/MATIC/4.26.22

MATIC/USDT 4-Hour Chart

Invalidation of the bearish idea is a close above $1.56. If the MATIC price can conquer this price territory, then the $1.70 target will be back on the table, resulting in a 35% increase from the current MATIC price.

Author

Tony M.

Tony M.

FXStreet Contributor

Tony Montpeirous began investing in cryptocurrencies in 2017. His trading style incorporates Elliot Wave, Auction Market Theory, Fibonacci and price action as the cornerstone of his technical analysis.

More from Tony M.
Share:

Editor's Picks

Bitcoin Weekly Forecast: BTC retreats as macro headwinds grow
Bitcoin (BTC) remains under pressure, down over 4% this week and trading around $76,900 at the time of writing on Friday. Institutional demand shows signs of weakness as spot BTC Exchange Traded Funds (ETFs) are on track to end their three-week inflow streak, recording nearly $500 million in net outflows through Thursday.
XRP falls toward key support as macro uncertainty, weak momentum cap recovery
Ripple (XRP) falls below $1.33 on Friday, marking the third consecutive day of declines. The token continues to track the broader cryptocurrency market downturn, with investors closely monitoring heightened macroeconomic uncertainty ahead of the United States (US) Consumer Price Index (CPI) release and next week’s Federal Reserve (Fed) monetary policy decision.
Crypto Today: Bitcoin, Ethereum, XRP stabilize at lower levels amid ETF outflows and macroeconomic risks
The broader cryptocurrency market is rising on Friday, with Bitcoin (BTC) trading above $77,000 after testing lower support near $76,500. Ethereum (ETH) shows signs of stability, hovering above the support provided at $2,400 despite capped upside at $2,500. Meanwhile, Ripple (XRP) holds above $1.33 after three straight days of declines, reflecting growing headwinds due to macroeconomic uncertainty.
Bitcoin pulls back as another golden cross fails to deliver
Earlier this week, Bitcoin formed a golden cross, a technical signal that occurs when the price’s 50-day moving average rises above the 200-day moving average and is conventionally viewed as a precursor to a bullish rally. Historically, however, that’s often not been the case.
Bitcoin: BTC retreats as macro headwinds grow
Bitcoin (BTC) remains under pressure, down over 4% this week and trading around $76,900 at the time of writing on Friday. Institutional demand shows signs of weakness as spot BTC Exchange Traded Funds (ETFs) are on track to end their three-week inflow streak, recording nearly $500 million in net outflows through Thursday.

