MATIC develops major bearish breakout pattern that could revisit $1.75
- MATIC continues to test the upper trendline of a rising wedge.
- Warning signs of support failing could initiate a 31% drop.
- Upside potential remains but is likely limited.

MATIC price action has recently generated significant warning signs regarding how much higher it can move over the short term. The past seven days have seen testing the upper trendline of a broader rising wedge pattern that has existed since September 2021.
MATIC price could drop over 30% and below the rising wedge pattern, liquidating many long positions
MATIC price is on a knife’s edge for bulls. MATIC is right on top of the upper trendline of a former rising wedge pattern on the daily candlestick chart. This represents the seventh major test of that trendline as support or resistance since November 2021. Contributing to the significant bearish warning signs present is the pattern developing on the $0.05/3-box reversal Point and Figure Chart.
There is a head-and-shoulders pattern and a quintuple-bottom bearish breakout trade setup for MATIC price. The theoretical short setup is a sell stop order at $2.40, a stop loss at $2.60, and a profit target at $1.75. This trade idea represents a 3.25:1 reward for the risk with an implied profit of 26% from the entry. A two-box trailing stop would help protect any profit generated post entry.
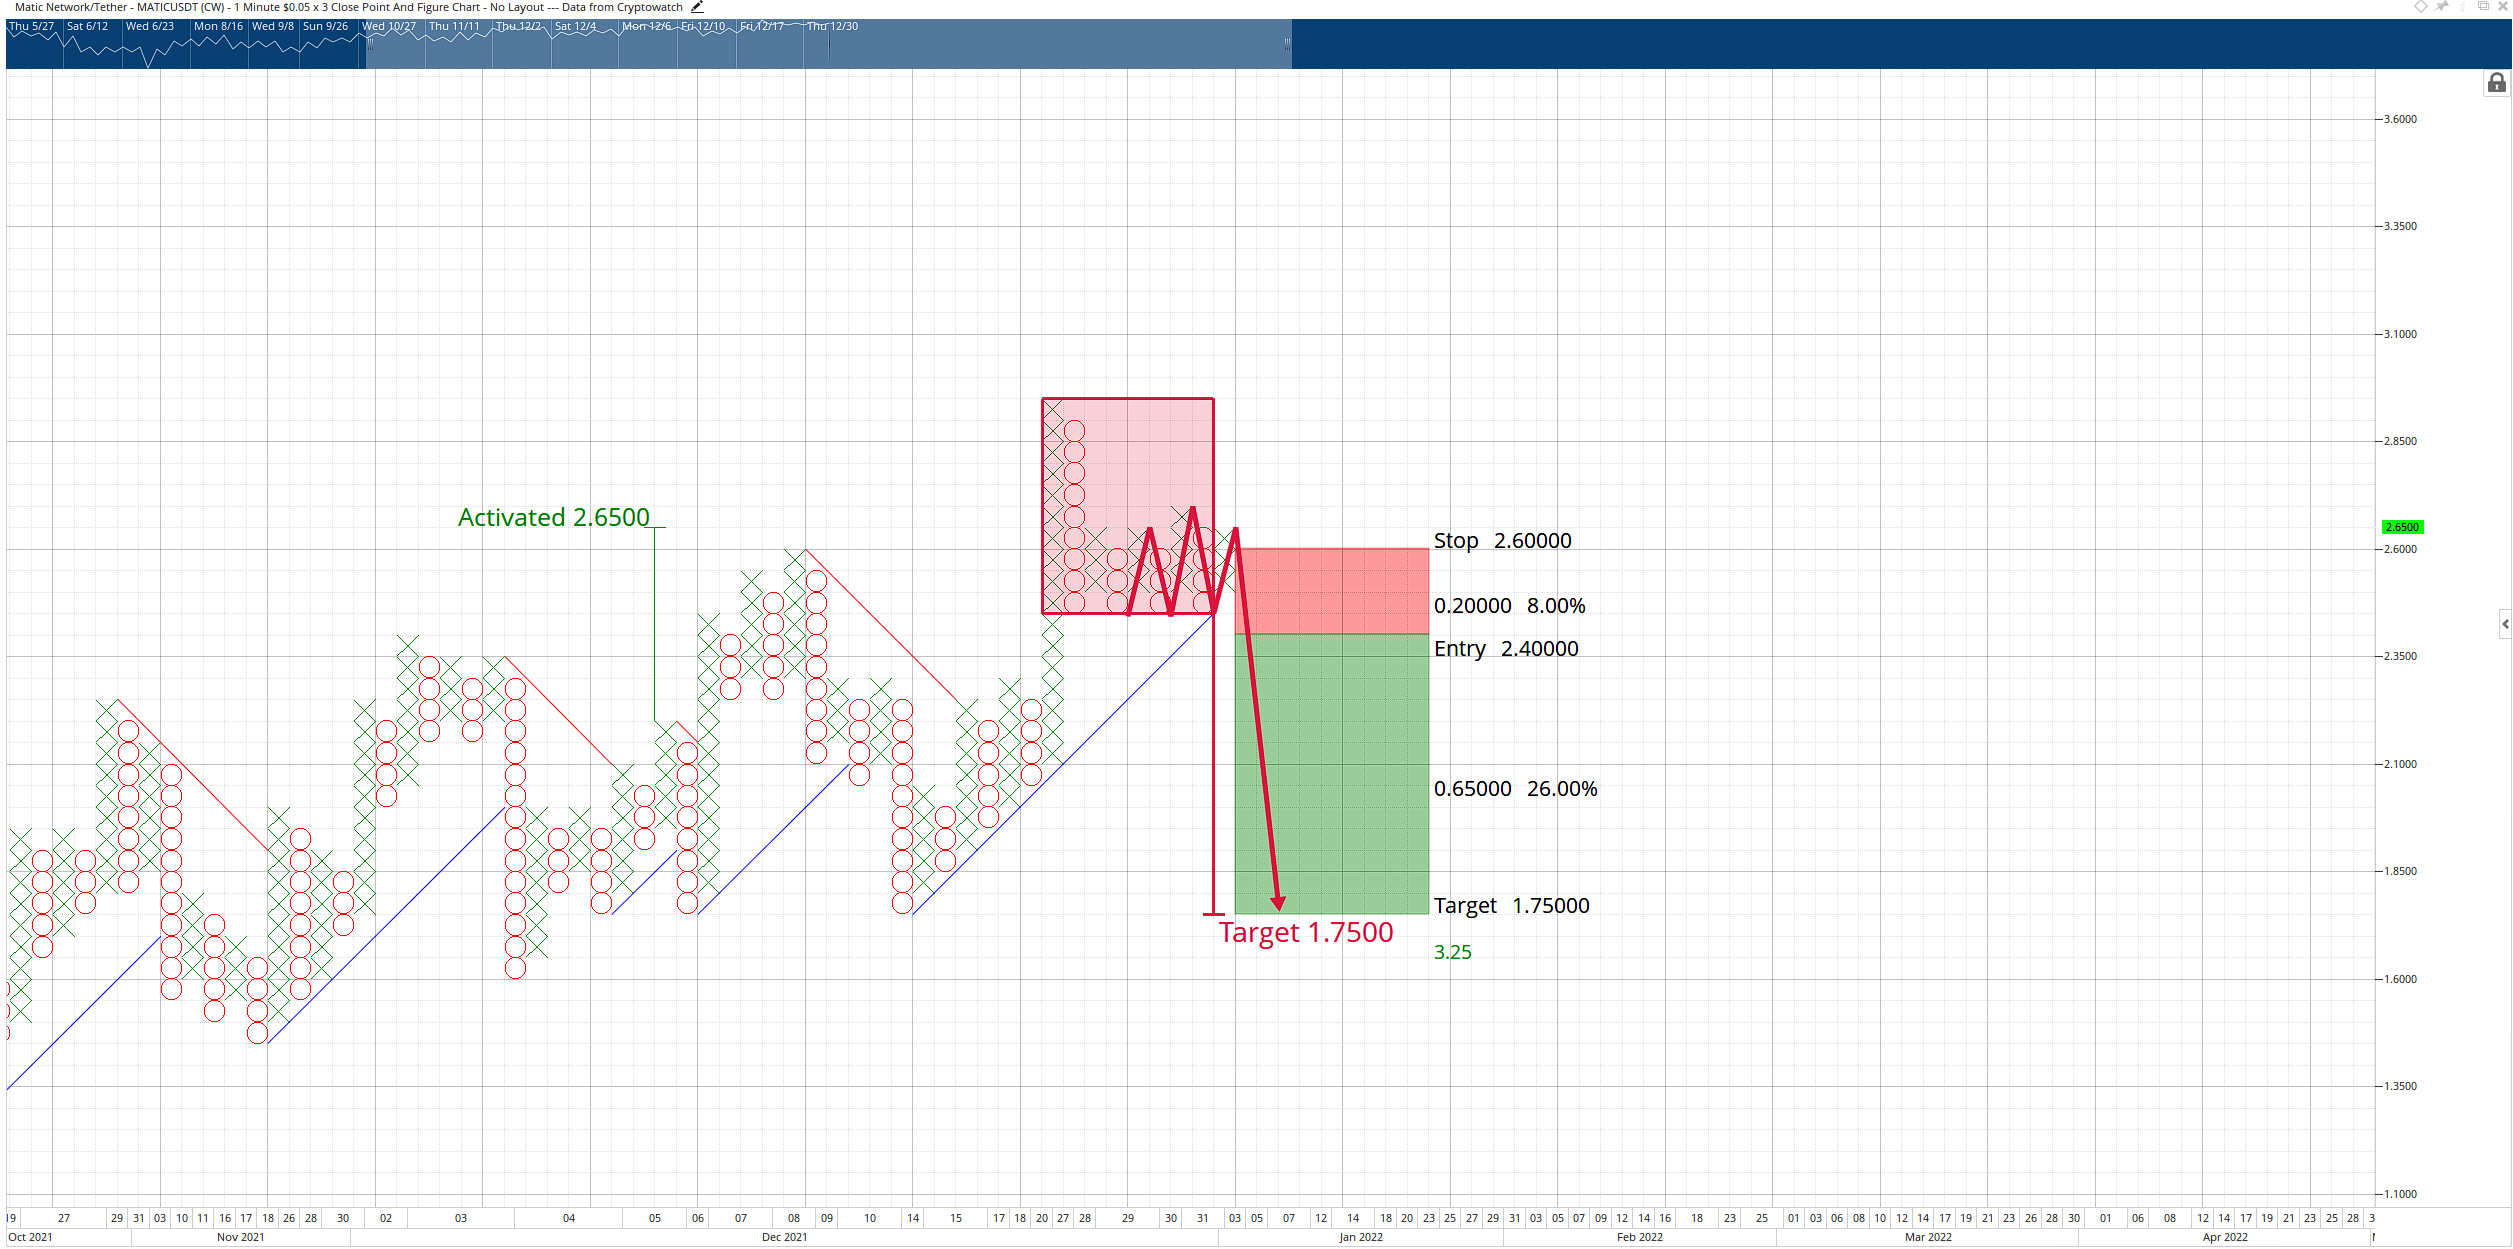
MATIC/USDT $0.05/3-box Reversal Point and Figure Chart
However, one of the most sought-after bullish patterns in Point and Figure is also developing for MATIC price. The Bullish Catapult pattern will be complete if the current X-column moves up to $2.75. That would invalidate the theoretical short entry.
The hypothetical long entry for MATIC price from the Bullish Catapult is a buy stop order at $2.75, a stop loss at $2.55, and a profit target at $3.35. This trade represents a 3:1 reward for the risk with an implied profit target of nearly 23% post entry.
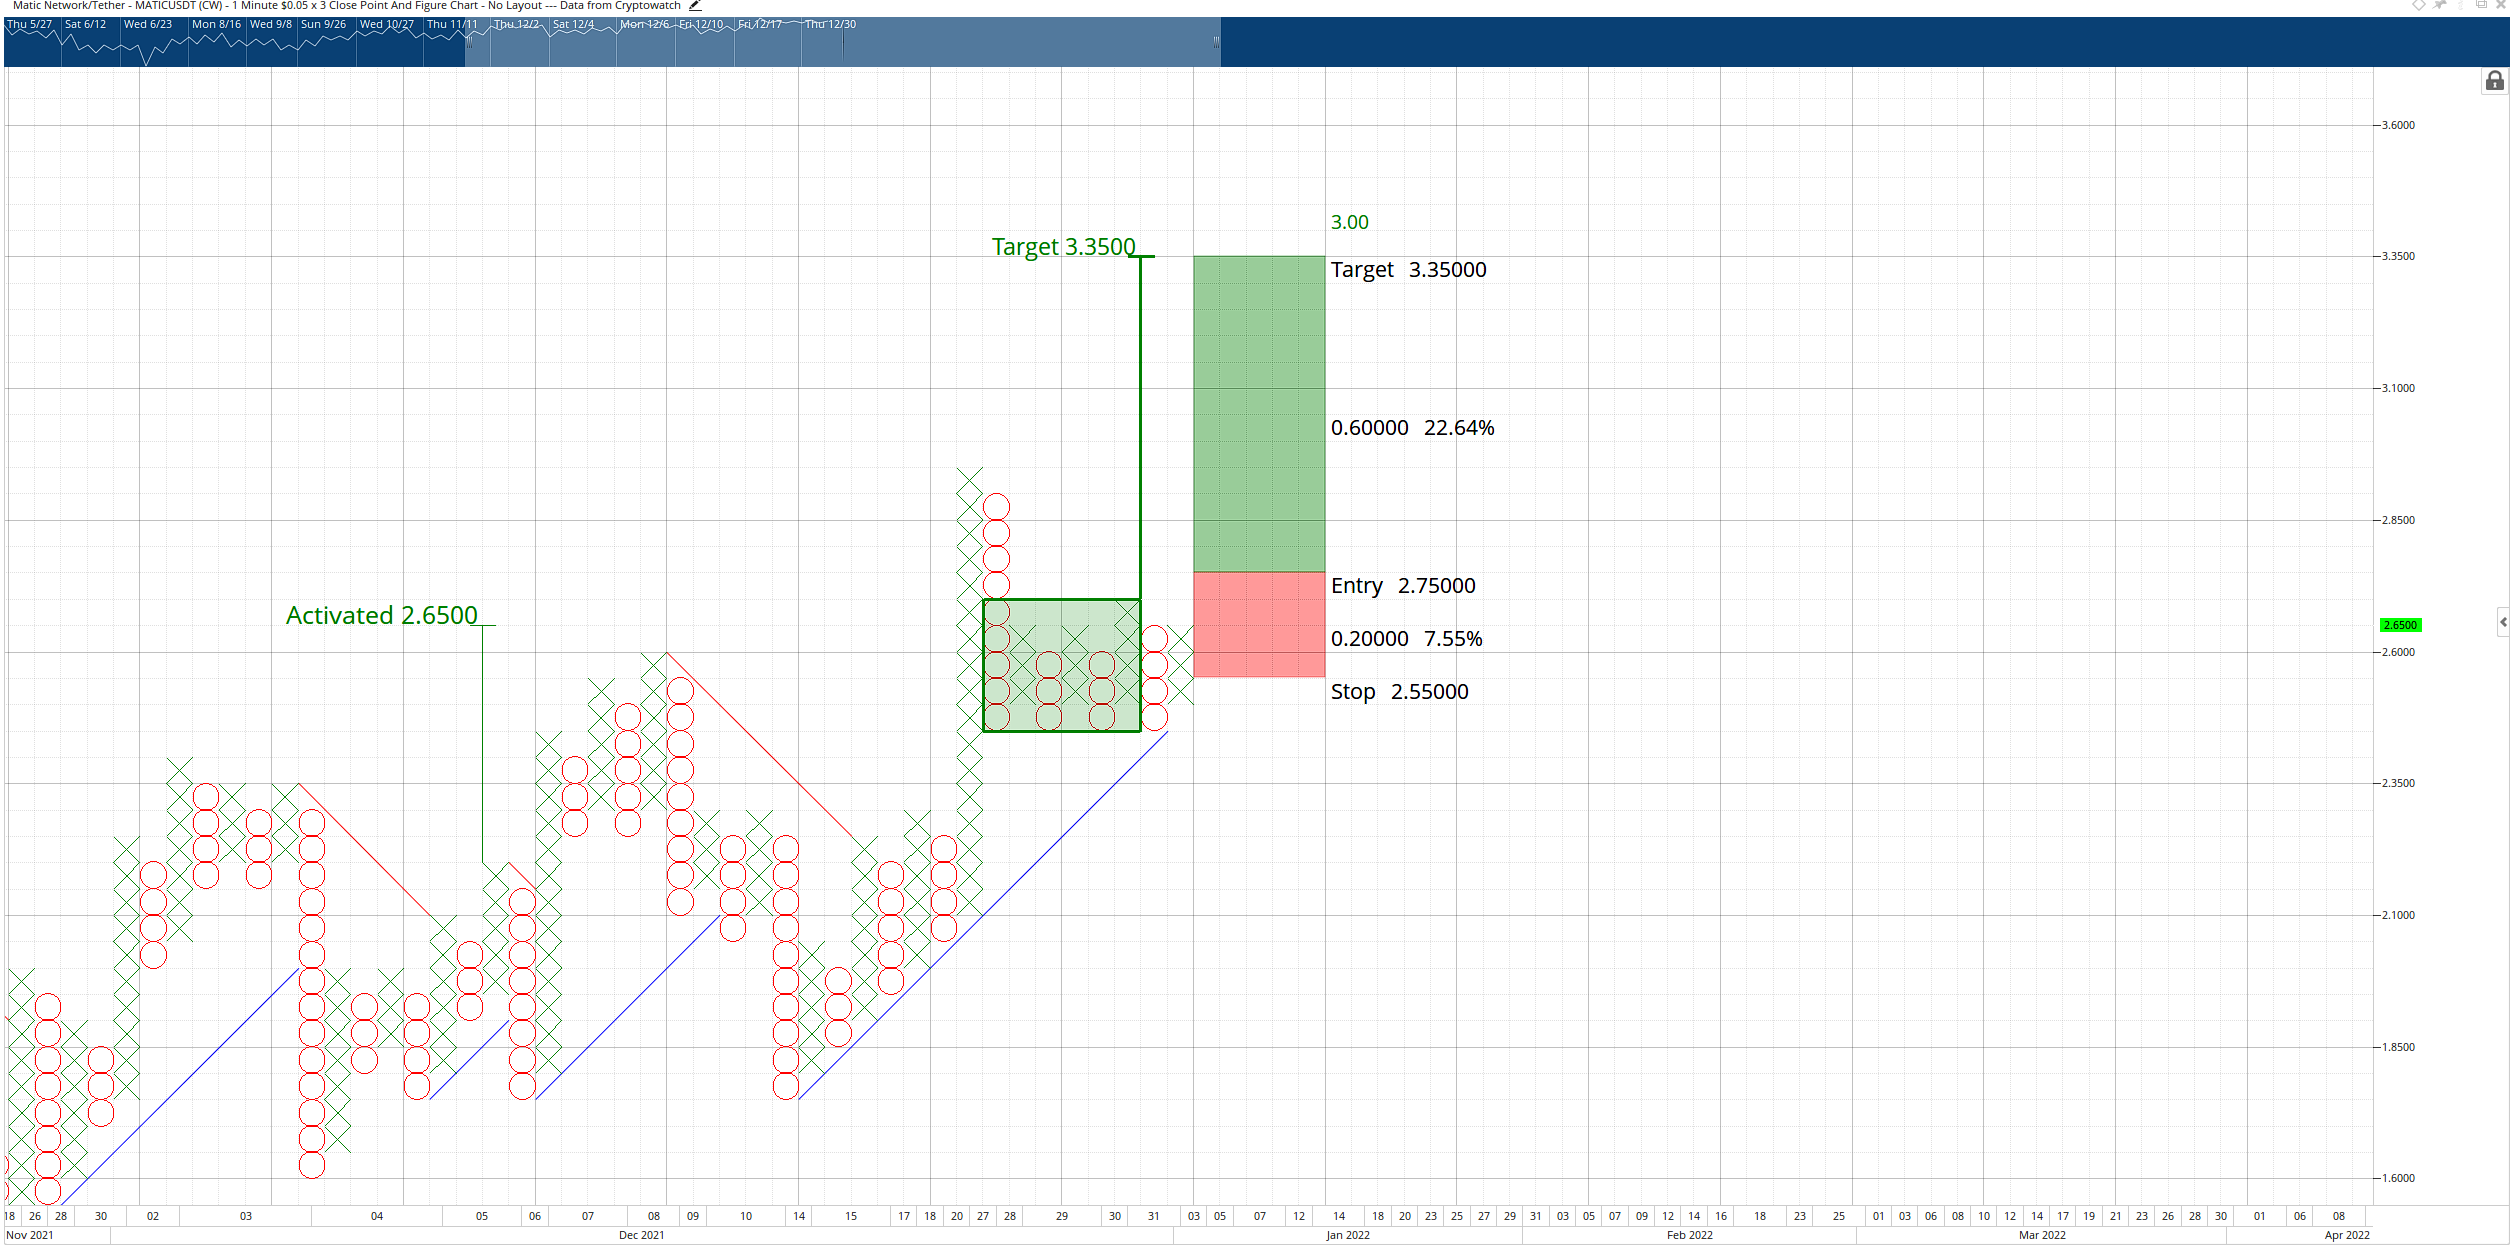
MATIC/USDT $0.05/3-box Reversal Point and Figure Chart
The long idea is invalidated if the short entry were to trigger first.
Author

Jonathan Morgan
Independent Analyst
Jonathan has been working as an Independent future, forex, and cryptocurrency trader and analyst for 8 years. He also has been writing for the past 5 years.


