MATIC price levels to watch next week: Polygon vulnerable below $1.50
- MATIC price action must hold nearby support zones to maintain a bullish bias.
- Strong near-term support may come under threat during the weekend trading sessions.
- This analysis identifies two ‘failure points’ that should be observed.

MATIC price action should be observed with scrutiny over this weekend. Despite having a new all-time highest weekly close established, MATIC price remains under technical bearish warning signs on the weekly chart.
MATIC price is close to confirming a bull market on the weekly chart
MATIC price is not yet confirmed bullish – on the weekly chart. On the daily chart, there are clear and undeniable reasons to have a robust and bullish bias. The weekly chart, however, does not. The Relative Strength Index remains in its bear market conditions because MATIC has yet to hit a bullish cross above 70. The weekly Relative Strength Index has been oscillating between the two overbought levels of 55 and 65 since the week of June 25th!
The first failure point to observe is a return and close below the upper trendline of the rising wedge. That would be a significantly bearish warning signal. However, the weekly Tenkan-Sen and Kijun-Sen share a support zone between $1.62 and $1.65, so any move below that upper trendline may be negated quickly if buyers come in to support MATIC price.
The second failure point, which would signal massive capitulation, would be a breach of the lower rising wedge trendline to a close below the October 1st weekly open at $1.11. Below That value area, the 2021 Volume Profile thins out considerably, and liquidation across the crypto-sphere would likely occur.
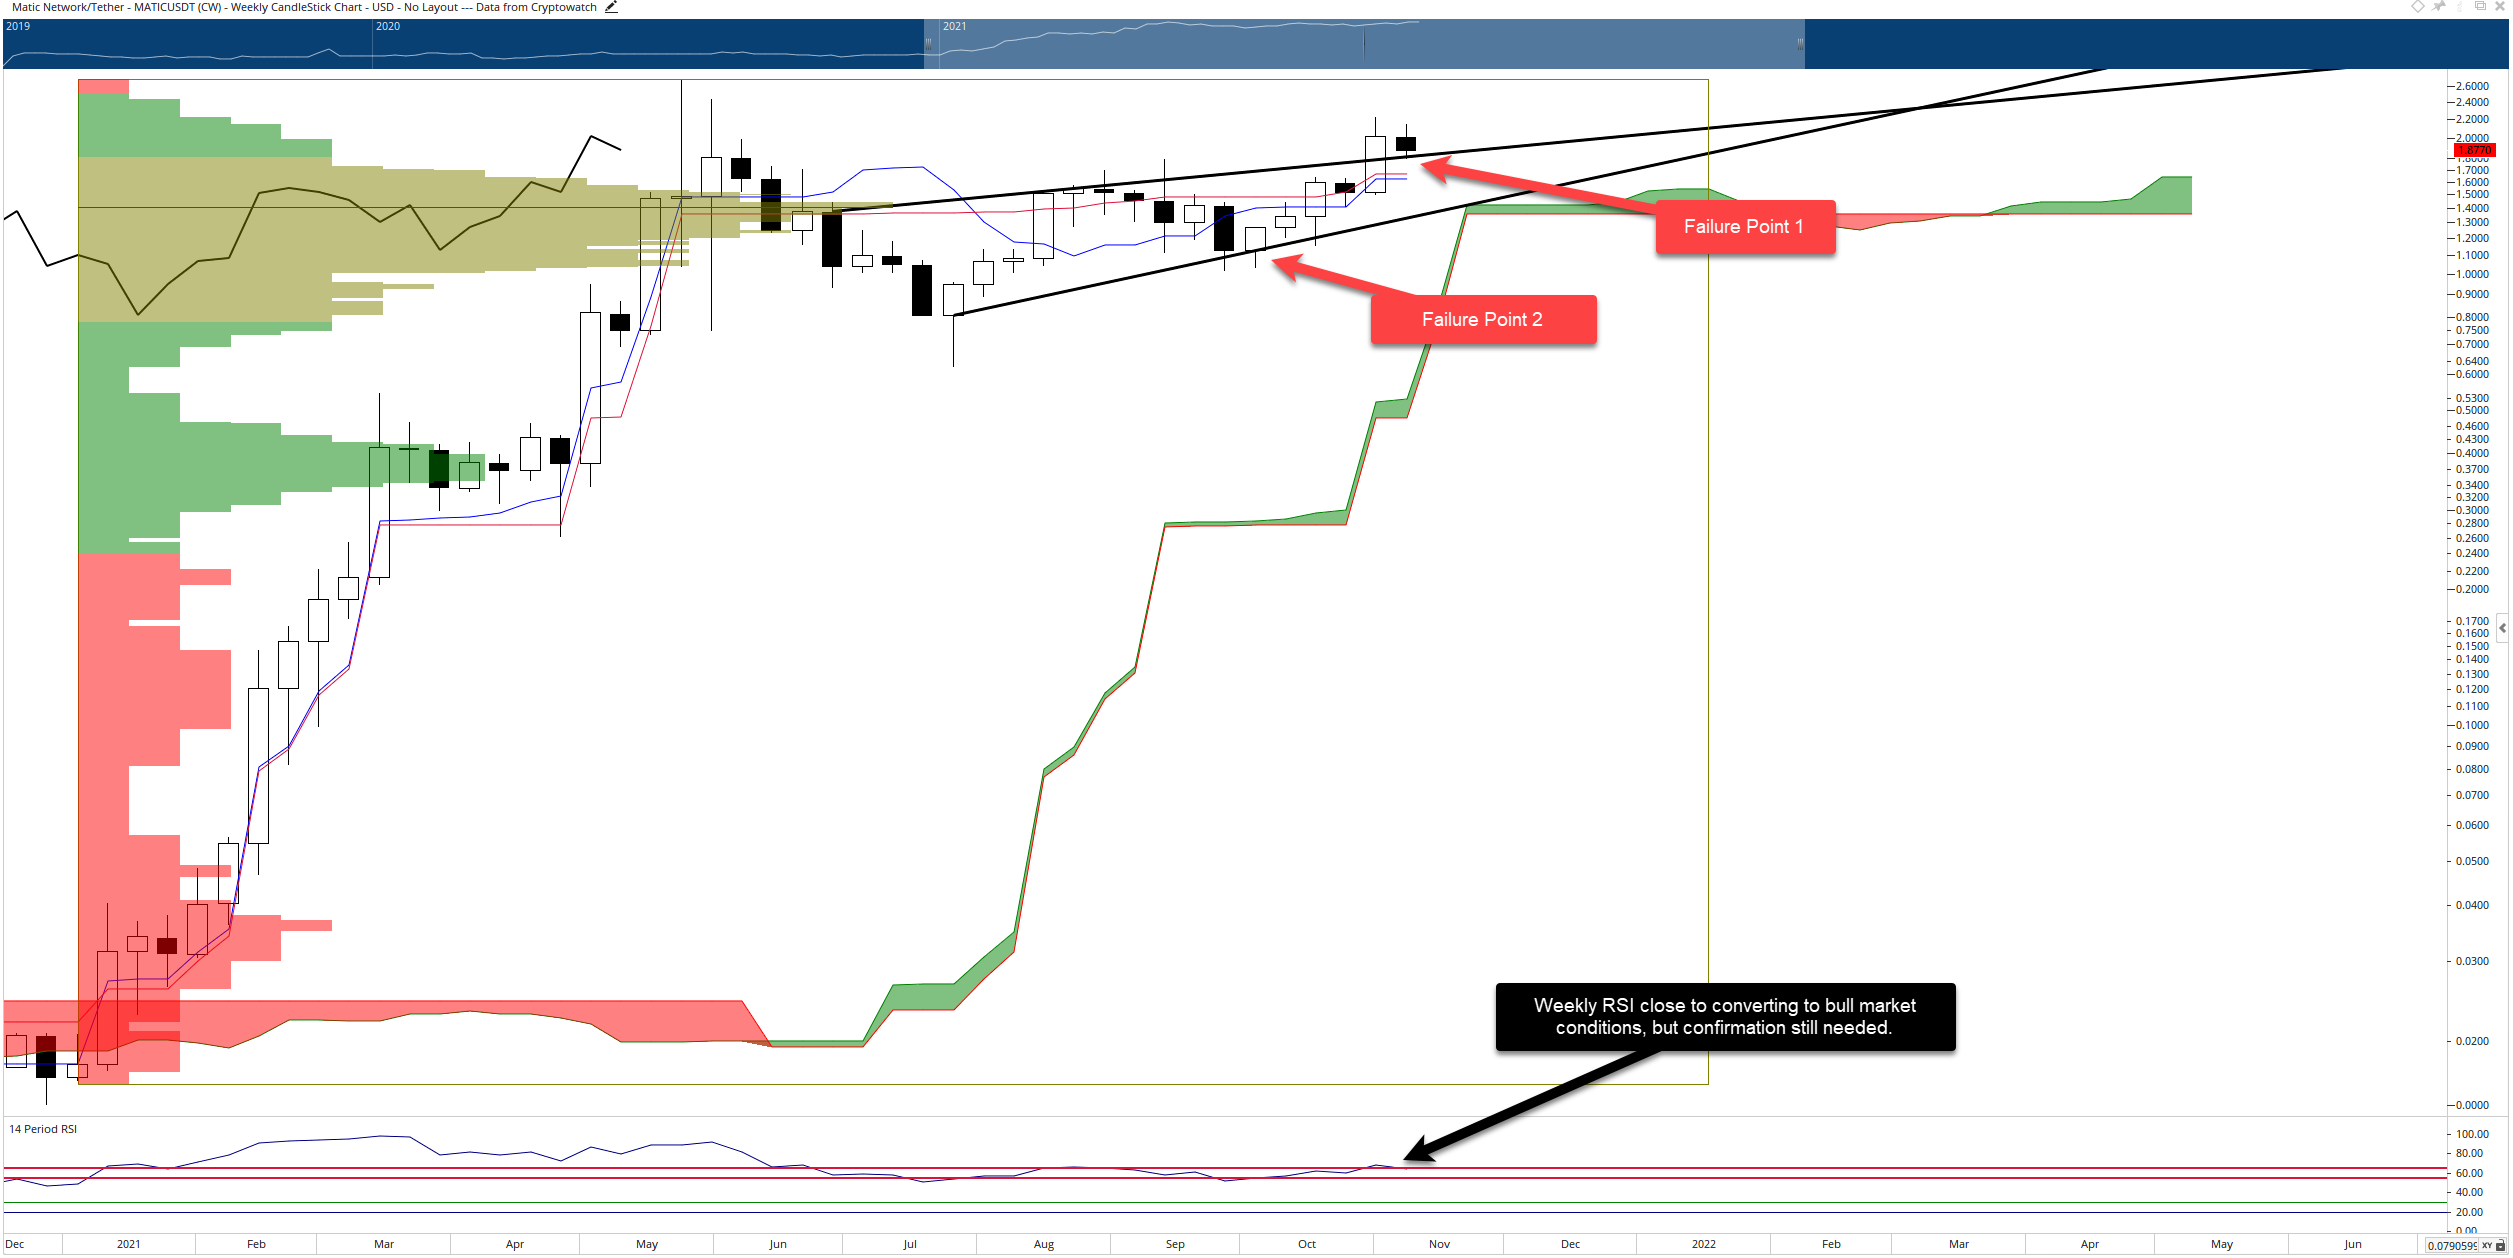
MATIC/USDT Weekly Ichimoku Chart
MATIC price must remain above the upper rising wedge trend line to invalidate all or some of the failure points. Of course, MATIC can trade below that trend line as much as it wants, but as long as the weekly candlesticks close above that trendline, bullish momentum should take over on the weekly chart.
Author

Jonathan Morgan
Independent Analyst
Jonathan has been working as an Independent future, forex, and cryptocurrency trader and analyst for 8 years. He also has been writing for the past 5 years.


