MATIC price eyes 110% advance as Polygon bulls wait with bated breath
- MATIC price is preparing for a 100% leg-up as a key bullish pattern develops.
- A decisive close above $1.63 will confirm the start of the uptrend to $2.63.
- A daily close below the $1.20 support floor will invalidate the bullish thesis.

MATIC price has been on a massive downswing after the September 7 crash, but things seem to be recovering as a bullish pattern continues to progress, and a buy signal is starting to line up.
MATIC price blast-off is around the corner
MATIC price witnessed a 38% sell-off between September 5 and September 7. However, the recovery was swift, pushing Polygon to $1.25, where it currently stands.
Going forward, investors can expect the altcoin to head higher due to three reasons; the market structure for the big crypto looks bullish, the inverse head and shoulder pattern and the Momentum Reversal Indicator (MRI) has flashed a ‘yellow’ up arrow, indicating that a buy signal is around the corner.
From June 5 to September 14, Polygon price formed three distinctive swing lows, with the central one deeper than the rest and known as the head. The valleys on either side of the head are known as shoulders. Drawing a trend line connecting the swing highs of these valleys shows a horizontal resistance barrier at $1.63, known as neckline.
This technical formation forecasts a 61% upswing from the ceiling mentioned above, obtained by measuring the distance between the neckline and the head’s lowest point. Adding this distance to the breakout point at $1.63 reveals the target at $2.63.
Initially, MATIC price needs to rally at least 30% to encounter and overcome a crucial resistance barrier at $1.63, aka the neckline. Doing so will open up the path for MATIC price to climb to the intended target.
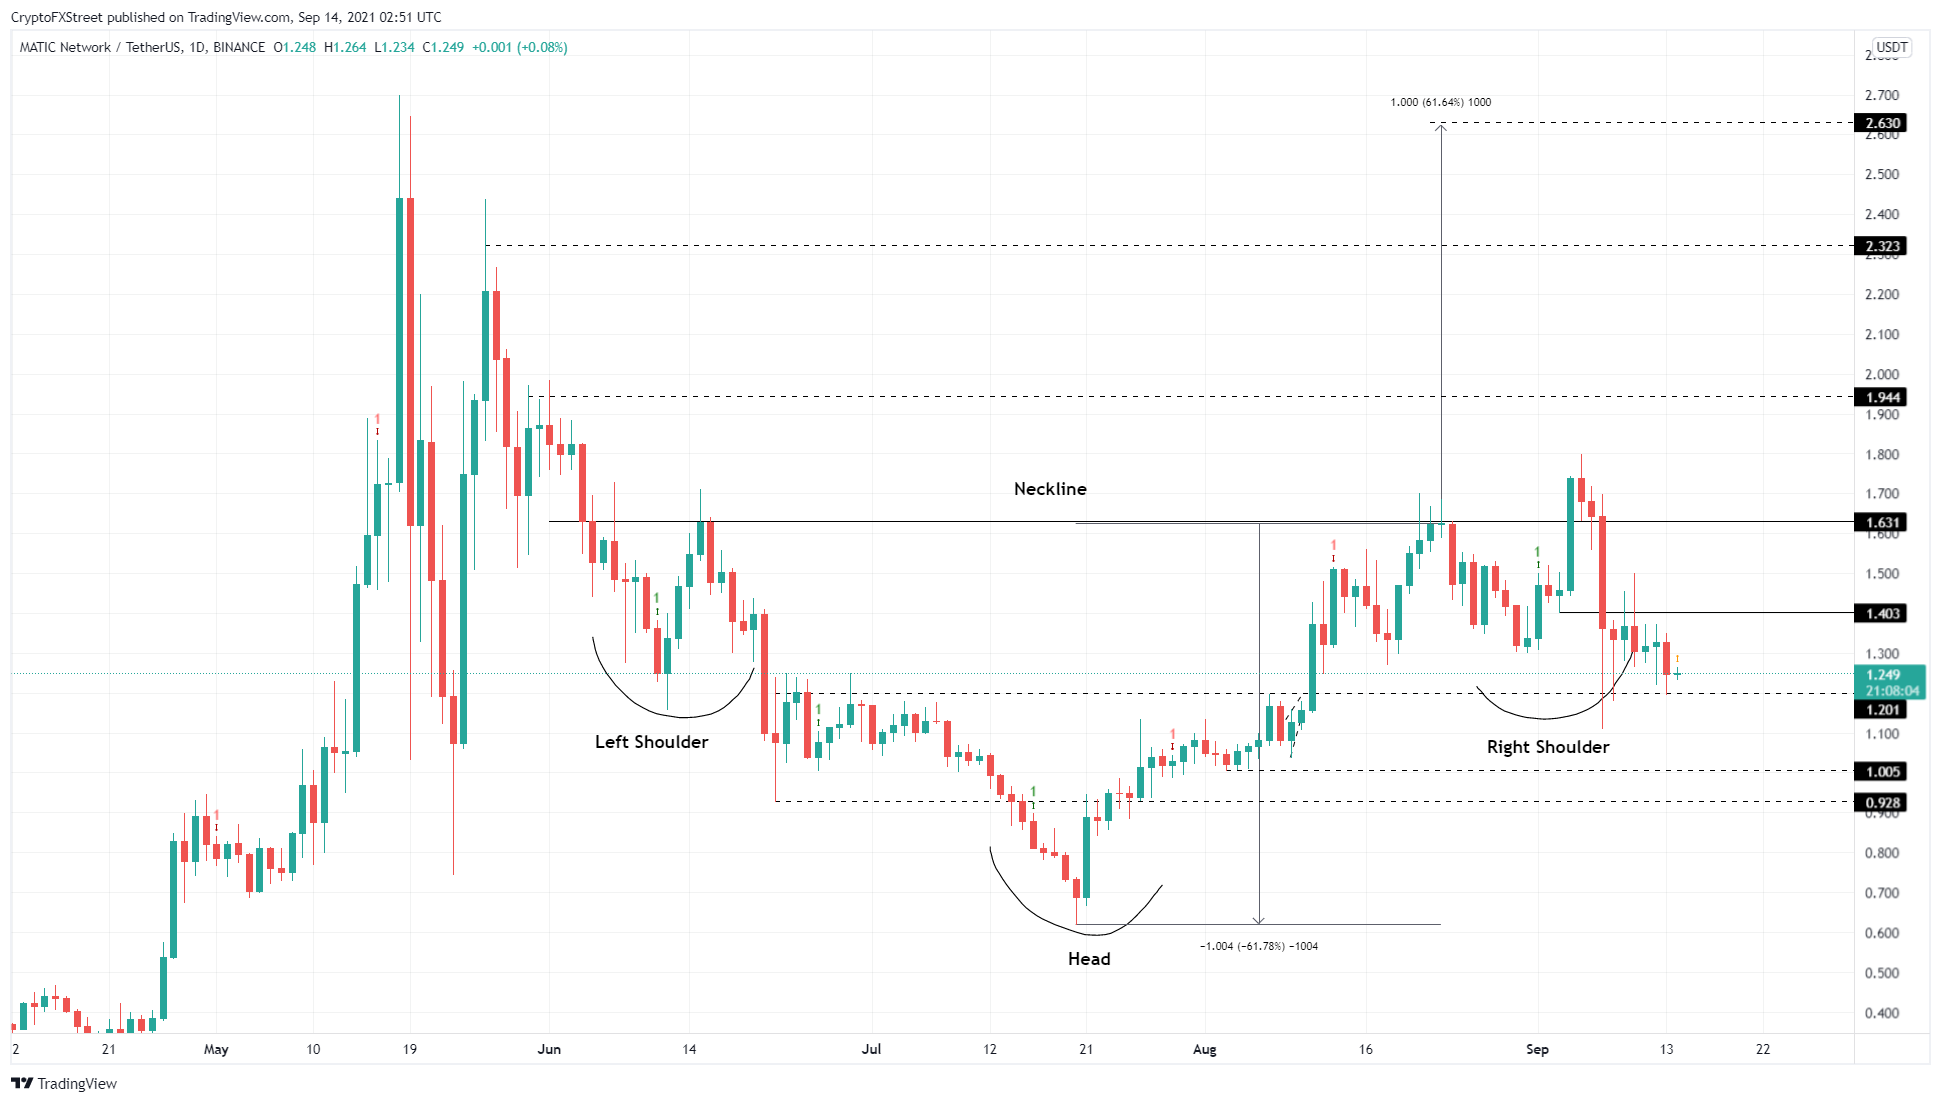
MATIC/USDT 1-day chart
On the other hand, if MATIC price fails to climb higher but heads lower and breaches the immediate support level at $1.20, it will create a lower low and invalidate the bullish thesis.
In such a case, Polygon could slide lower to $1 and, in some cases, $0.93.
Author

Akash Girimath
FXStreet
Akash Girimath is a Mechanical Engineer interested in the chaos of the financial markets. Trying to make sense of this convoluted yet fascinating space, he switched his engineering job to become a crypto reporter and analyst.




