Maple Finance Price Forecast: SYRUP prepares for a breakout as bearish pressure fades
- Maple Finance price tests the key 50-day EMA at $0.34 on Wednesday.
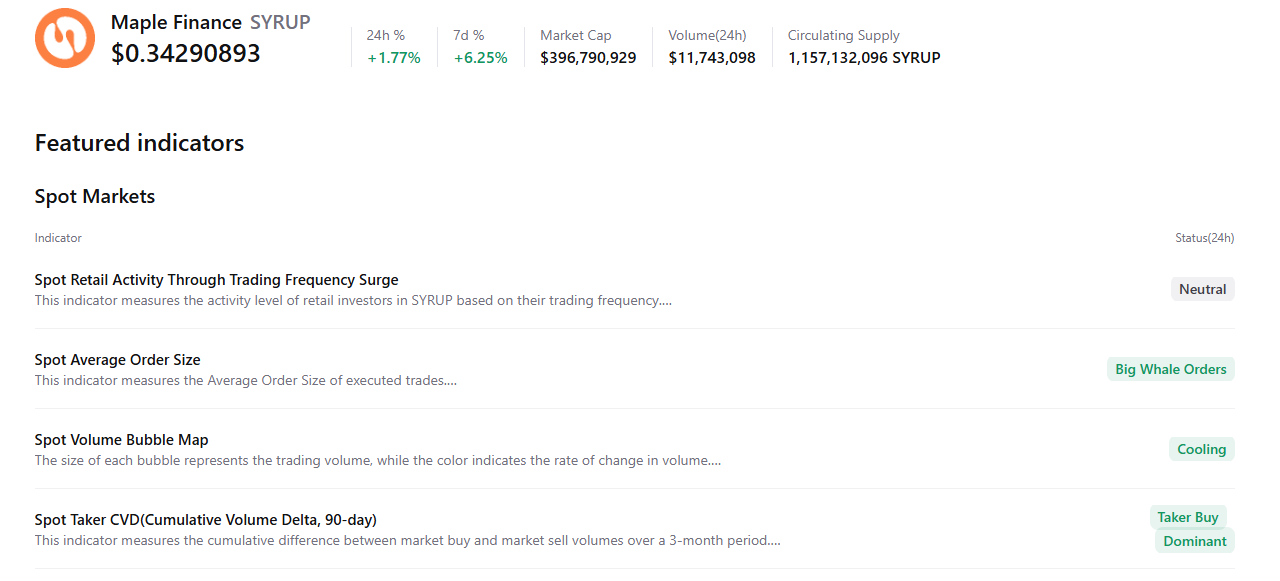
- On-chain data support a bullish picture, as the spot market shows large whale orders, cooling conditions, and buy-side dominance.
- The technical outlook supports a potential breakout, as momentum indicators signal fading bearish momentum.

Maple Finance (SYRUP) price is retesting the key resistance level at $0.34 on Wednesday, a firm close above suggests an upside move. The bullish price action is supported by on-chain data, including rising large-whale orders, cooling conditions, and buy-side dominance. On the technical side, momentum indicators suggest bulls are preparing for a breakout as bearish pressure fades.
Bullish on-chain data hints at a potential breakout
CryptoQuant’s summary data supports the bullish outlook, as SYRUP’s spot markets show large whale orders, cooling conditions, and buy dominance. All these factors suggest that Maple Finance may be positioning for a breakout in the coming days.
Maple Finance Price Forecast: SYRUP could extend gains if it closes above $0.34
Maple Finance's price found support at the daily $0.30 level on Sunday and rebounded by over 11% in the next two days. At the time of writing on Wednesday, SYRUP is nearing the 50-day Exponential Moving Average (EMA) at $0.34.
If SYRUP breaks and closes above the 50-day EMA at $0.30 on a daily basis, it could extend the rally toward the next daily resistance at $0.39, which roughly coincides with the volume profile Point of Control (POC), the price level with the highest traded volume since September 20.
The Relative Strength Index (RSI) on the daily chart is 48, pointing upward toward the neutral 50 level, indicating fading bearish momentum. For the recovery rally to be sustained, the RSI must move above the neutral level. In addition, the Moving Average Convergence Divergence (MACD) lines are converging, with fading red histogram levels below the zero line, further supporting the potential recovery thesis.
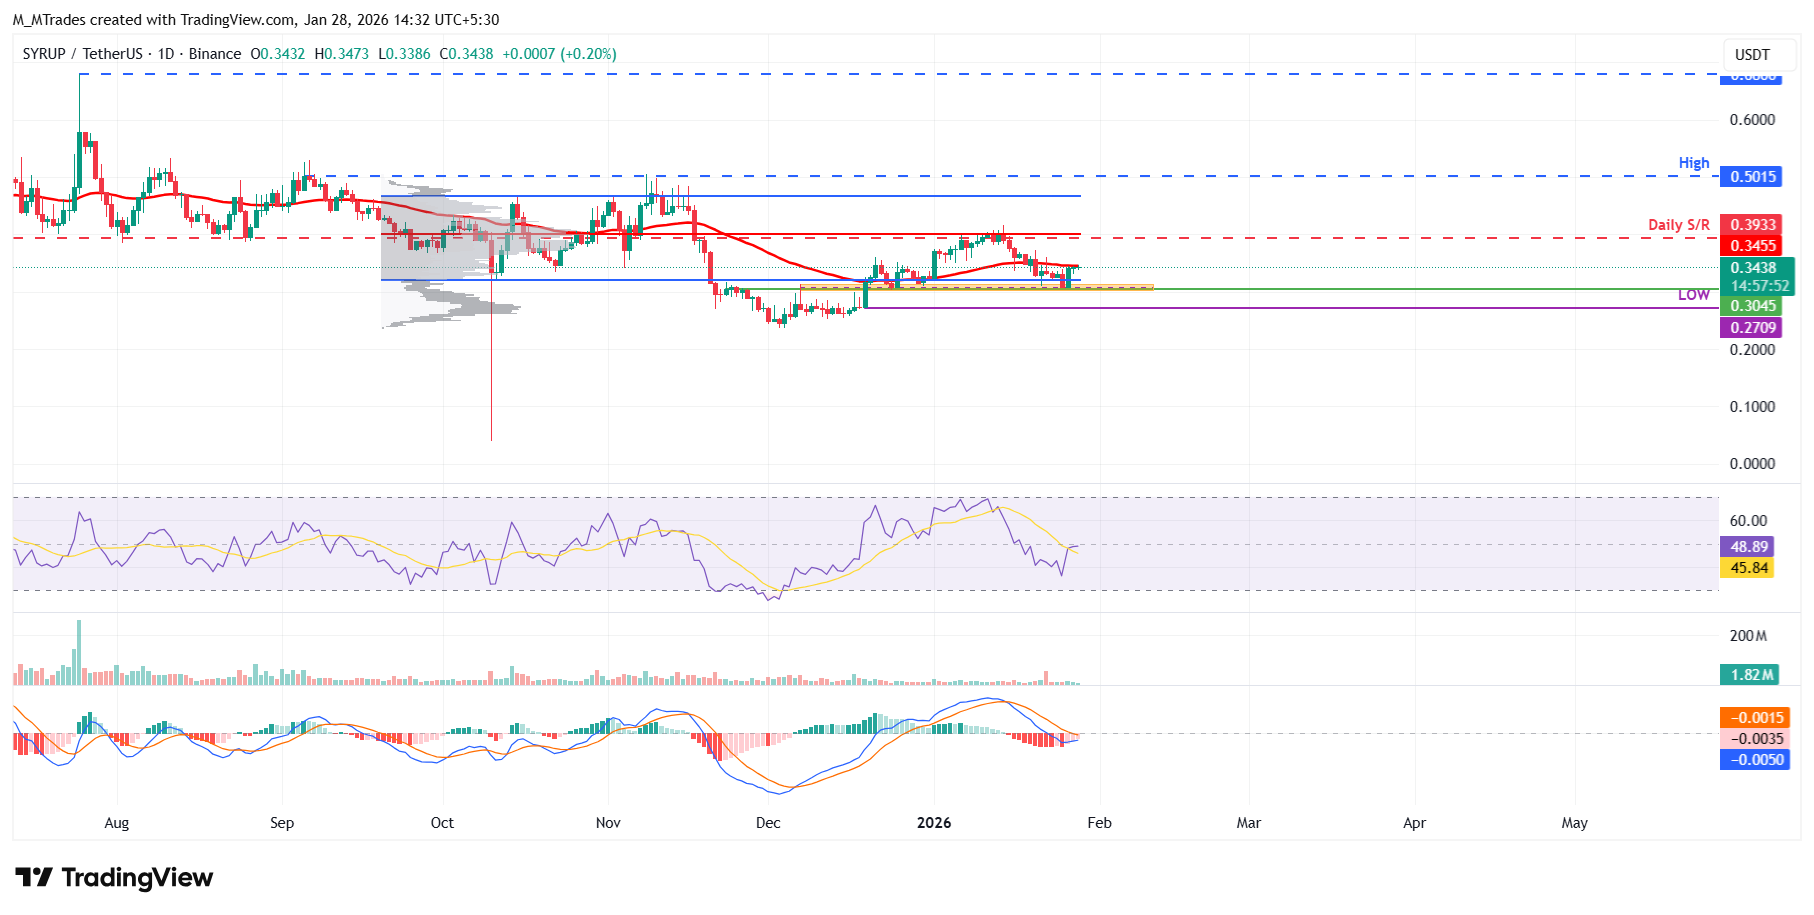
On the other hand, if SYRUP closes below $0.30, it could extend the correction to the December 19 low at $0.27.
Author

Manish Chhetri
FXStreet
Manish Chhetri is a crypto specialist with over four years of experience in the cryptocurrency industry.



