|

LTC/USD technical analysis: Litecoin is looking for support levels

  • All the major cryptocurrencies are trading in the red today and Litecoin is 1.71% lower.
  • The RSI is giving a bullish signal but it still needs to be confirmed.

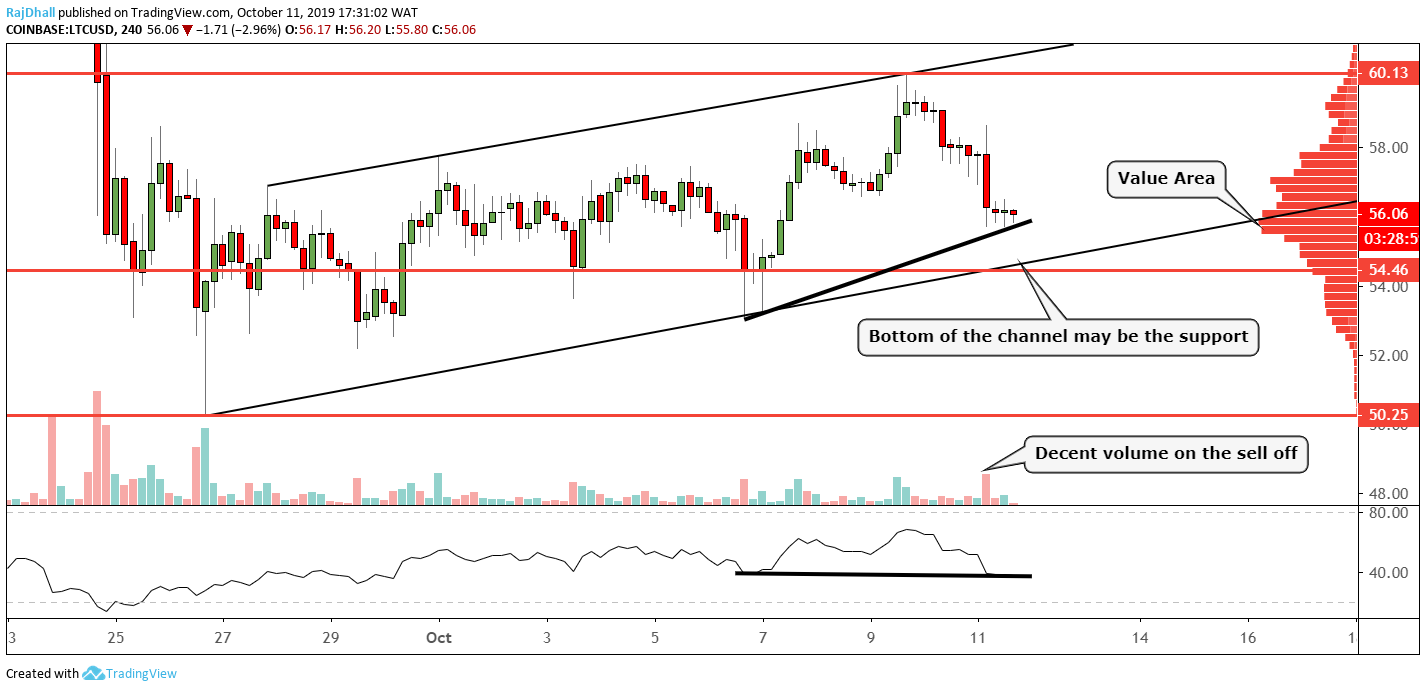
LTC/USD has found some support at the value area on the volume profile indicator on the right-hand side of the chart.

This represents the area where most volume has been traded and in this case, it is at 55.80.

The relative strength index (RSI) indicator is showing a bullish failure swing. This is when the indicator makes a wave low but the price makes a higher low.

There has been decent volume on the sell-off but we need to see what happens when the Asian traders come to market.

The psychological 60 level on the upside is the target for the bulls and this is where price stalled on the last bullish run.

Litecoin Analysis

LTC/USD

Overview
Today last price56.1386
Today Daily Change -1.6227
Today Daily Change %-2.81
Today daily open57.7613
 
Trends
Daily SMA2058.5022
Daily SMA5065.5231
Daily SMA10079.9328
Daily SMA20088.304
 
Levels
Previous Daily High59.4981
Previous Daily Low57.2165
Previous Weekly High57.7344
Previous Weekly Low52.1872
Previous Monthly High80.2956
Previous Monthly Low50.399
Daily Fibonacci 38.2%58.0881
Daily Fibonacci 61.8%58.6265
Daily Pivot Point S156.8192
Daily Pivot Point S255.8771
Daily Pivot Point S354.5377
Daily Pivot Point R159.1008
Daily Pivot Point R260.4402
Daily Pivot Point R361.3823

Author

Rajan Dhall, MSTA

Rajan Dhall is an experienced market analyst, who has been trading professionally since 2007 managing various funds producing exceptional returns.

More from Rajan Dhall, MSTA
Share:

Editor's Picks

Ripple exposed to volatility amid low retail interest, modest fund inflows

Ripple (XRP) is extending its intraday decline to around $1.40 at the time of writing on Monday amid growing pressure from the retail market and risk-off sentiment that continues to keep investors on the sidelines.

Crypto Today: Bitcoin steadies around $70,000, Ethereum and XRP remain under pressure 

Bitcoin hovers around $70,000, up near 15% from last week's low of $60,000 despite low retail demand. Ethereum delicately holds $2,000 support as weak technicals weigh amid declining futures Open Interest.

Pi Network extends decline as steady mainnet migration adds pressure

PI edges lower by over 3% at press time on Monday, marking a third consecutive day of losses. The declining trend in PI aligns with the steady mainnet migration of PI tokens, which may fuel selling pressure. The technical outlook for PI remains bearish, with bearish momentum persisting. 

Bitcoin slips below $70,000 as ETF outflows, realized losses fuel bearish outlook

Bitcoin price trades in red below $70,000 on Monday after correcting nearly 9% in the previous week. US-listed spot ETFs recorded a $318 million weekly outflow, marking the third consecutive week of withdrawals.

Bitcoin Price Annual Forecast: BTC holds long-term bullish structure heading into 2026

Bitcoin (BTC) is wrapping up 2025 as one of its most eventful years, defined by unprecedented institutional participation, major regulatory developments, and extreme price volatility.

Bitcoin: The worst may be behind us

Bitcoin (BTC) price recovers slightly, trading at $65,000 at the time of writing on Friday, after reaching a low of $60,000 during the early Asian trading session. The Crypto King remained under pressure so far this week, posting three consecutive weeks of losses exceeding 30%.