Litecoin technical analysis: LTC/USD rallied 12% to the upside, but runs into heavy supply zone, support caught at 61.8% Fibonacci
- Litecoin gains 12% midway in the US session, however upside was cut short by heavy supply zone within the early to mid-$120 region.
- The RSI went well into overbought territory, pushing above 80, where sellers then entered the market.
- Current price action has received some support above a descending trend line, running from 25th May.

LTC/USD 30-minute chart
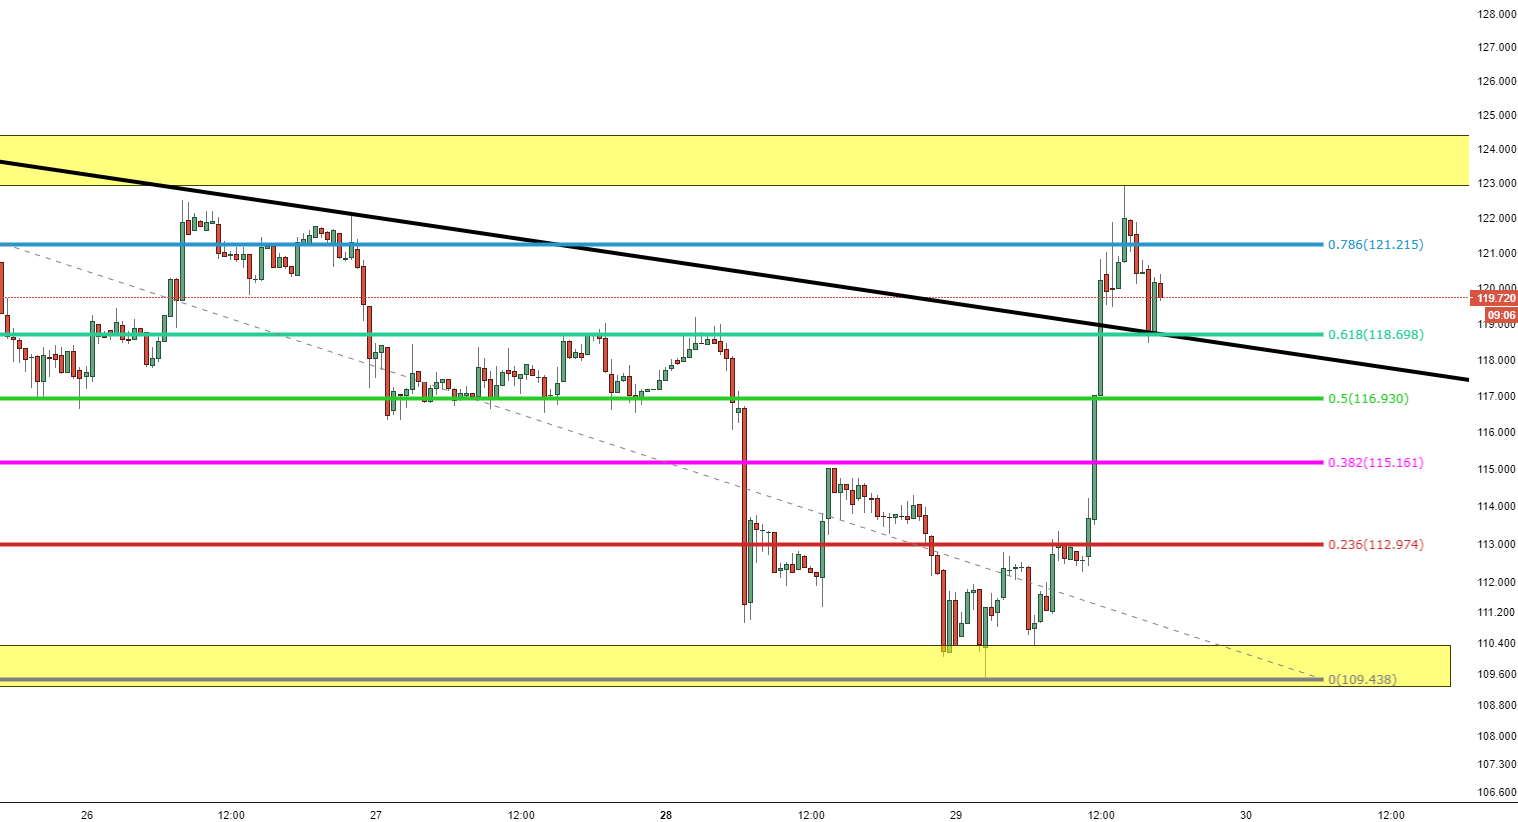
Spot rate: 120.00
Relative change: +8.25%
High: 122.90
Low: 109.40
Trend: Bullish/Neutral
Resistance 1: 120.00
Resistance 2: 122.10 heavy supply zone that held back upside on 26th May.
Resistance 3: 122.95 today’s high (Tuesday).
Support 1: 118.70, on top of descending trend line and 61.8% Fibonacci.
Support 2: 117.00 50% Fibonacci.
Support 3: 115.15 38.2% Fibonacci.
Author

Ken Chigbo
Independent Analyst
Ken has over 8 years exposure to the financial markets. He started his career as an analyst, covering a variety of asset classes; forex, fixed income, commodities and equities.


