Litecoin Technical Analysis: LTC/USD crafting a reversal doji
- Litecoin price nursing huge losses of 9.5% in the latter stages of Monday's session.
- LTC/USD smashed out to the downside from a supporting ascending trend line. This had been running from 25th November.

LTC/USD 4-hour chart
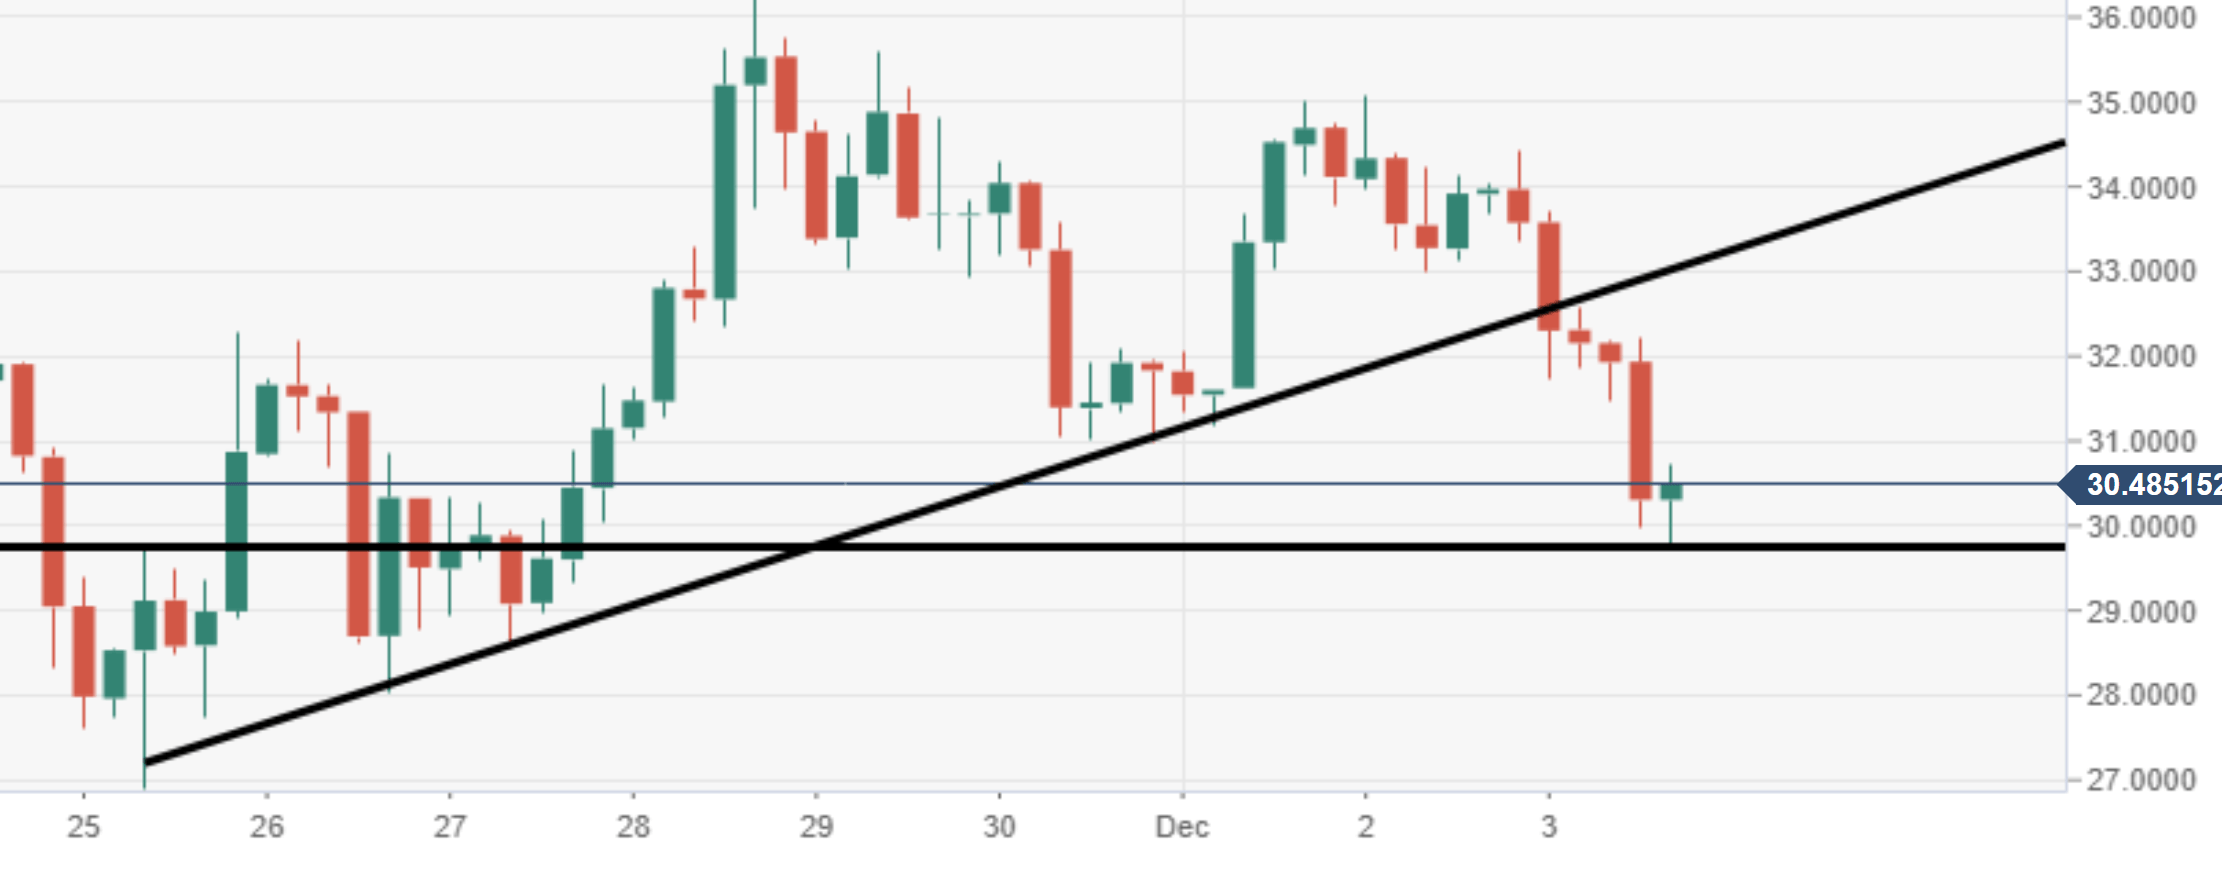
Spot rate: 30.45
Relative change: -9.65%
High: 33.69
Low: 29.76
Trend: Bearish
Support 1: 29.86, 4-hour support.
Support 2: 27.75, demand zone.
Support 3: 26.91, monthly low.
Resistance 1: 33.15, breached ascending trend line.
Resistance 2: 34.77, daily pivot point resistance.
Resistance 3: 35.96, daily pivot point resistance.
Author

Ken Chigbo
Independent Analyst
Ken has over 8 years exposure to the financial markets. He started his career as an analyst, covering a variety of asset classes; forex, fixed income, commodities and equities.
More from Ken Chigbo


