Litecoin price runs into 6.83 million LTC resistance cluster as open interest expands
- Litecoin price crosses above $90 for the first time in 40 days, reflecting risk-on sentiment in the broader crypto market.
- The RSI indicator’s upward trend below overbought levels signals robust bullish momentum.
- Litecoin faces a weighty resistance cluster between $92 and $95, where over 204,000 addresses previously purchased 6.83 million LTC.

Litecoin (LTC) price gains bullish momentum, extending the previous day’s positive move to trade at $92 at the time of writing on Wednesday, as markets gauge the potential impact of the Federal Reserve’s (Fed) interest rates decision during the American session. Although the central bank is expected to leave the rates unchanged at the 4.25%-4.5% range, the Fed Chair Jerome Powell’s comments would expand on the policy amid thawing trade tensions. Planned trade talks between the United States (US) and China could give insight into the market’s direction later this week.
Litecoin’s surge above $90 supports the bullish case
Litecoin’s price recovery from the tariff-triggered crash to $63 on April 7 signals the likelihood of a long-term uptrend. This bullish outlook comes after LTC broke above key levels like the resistance-turned support at $80, the 50-day Exponential Moving Average (EMA) at approximately $86, and the 100-day EMA at $92.
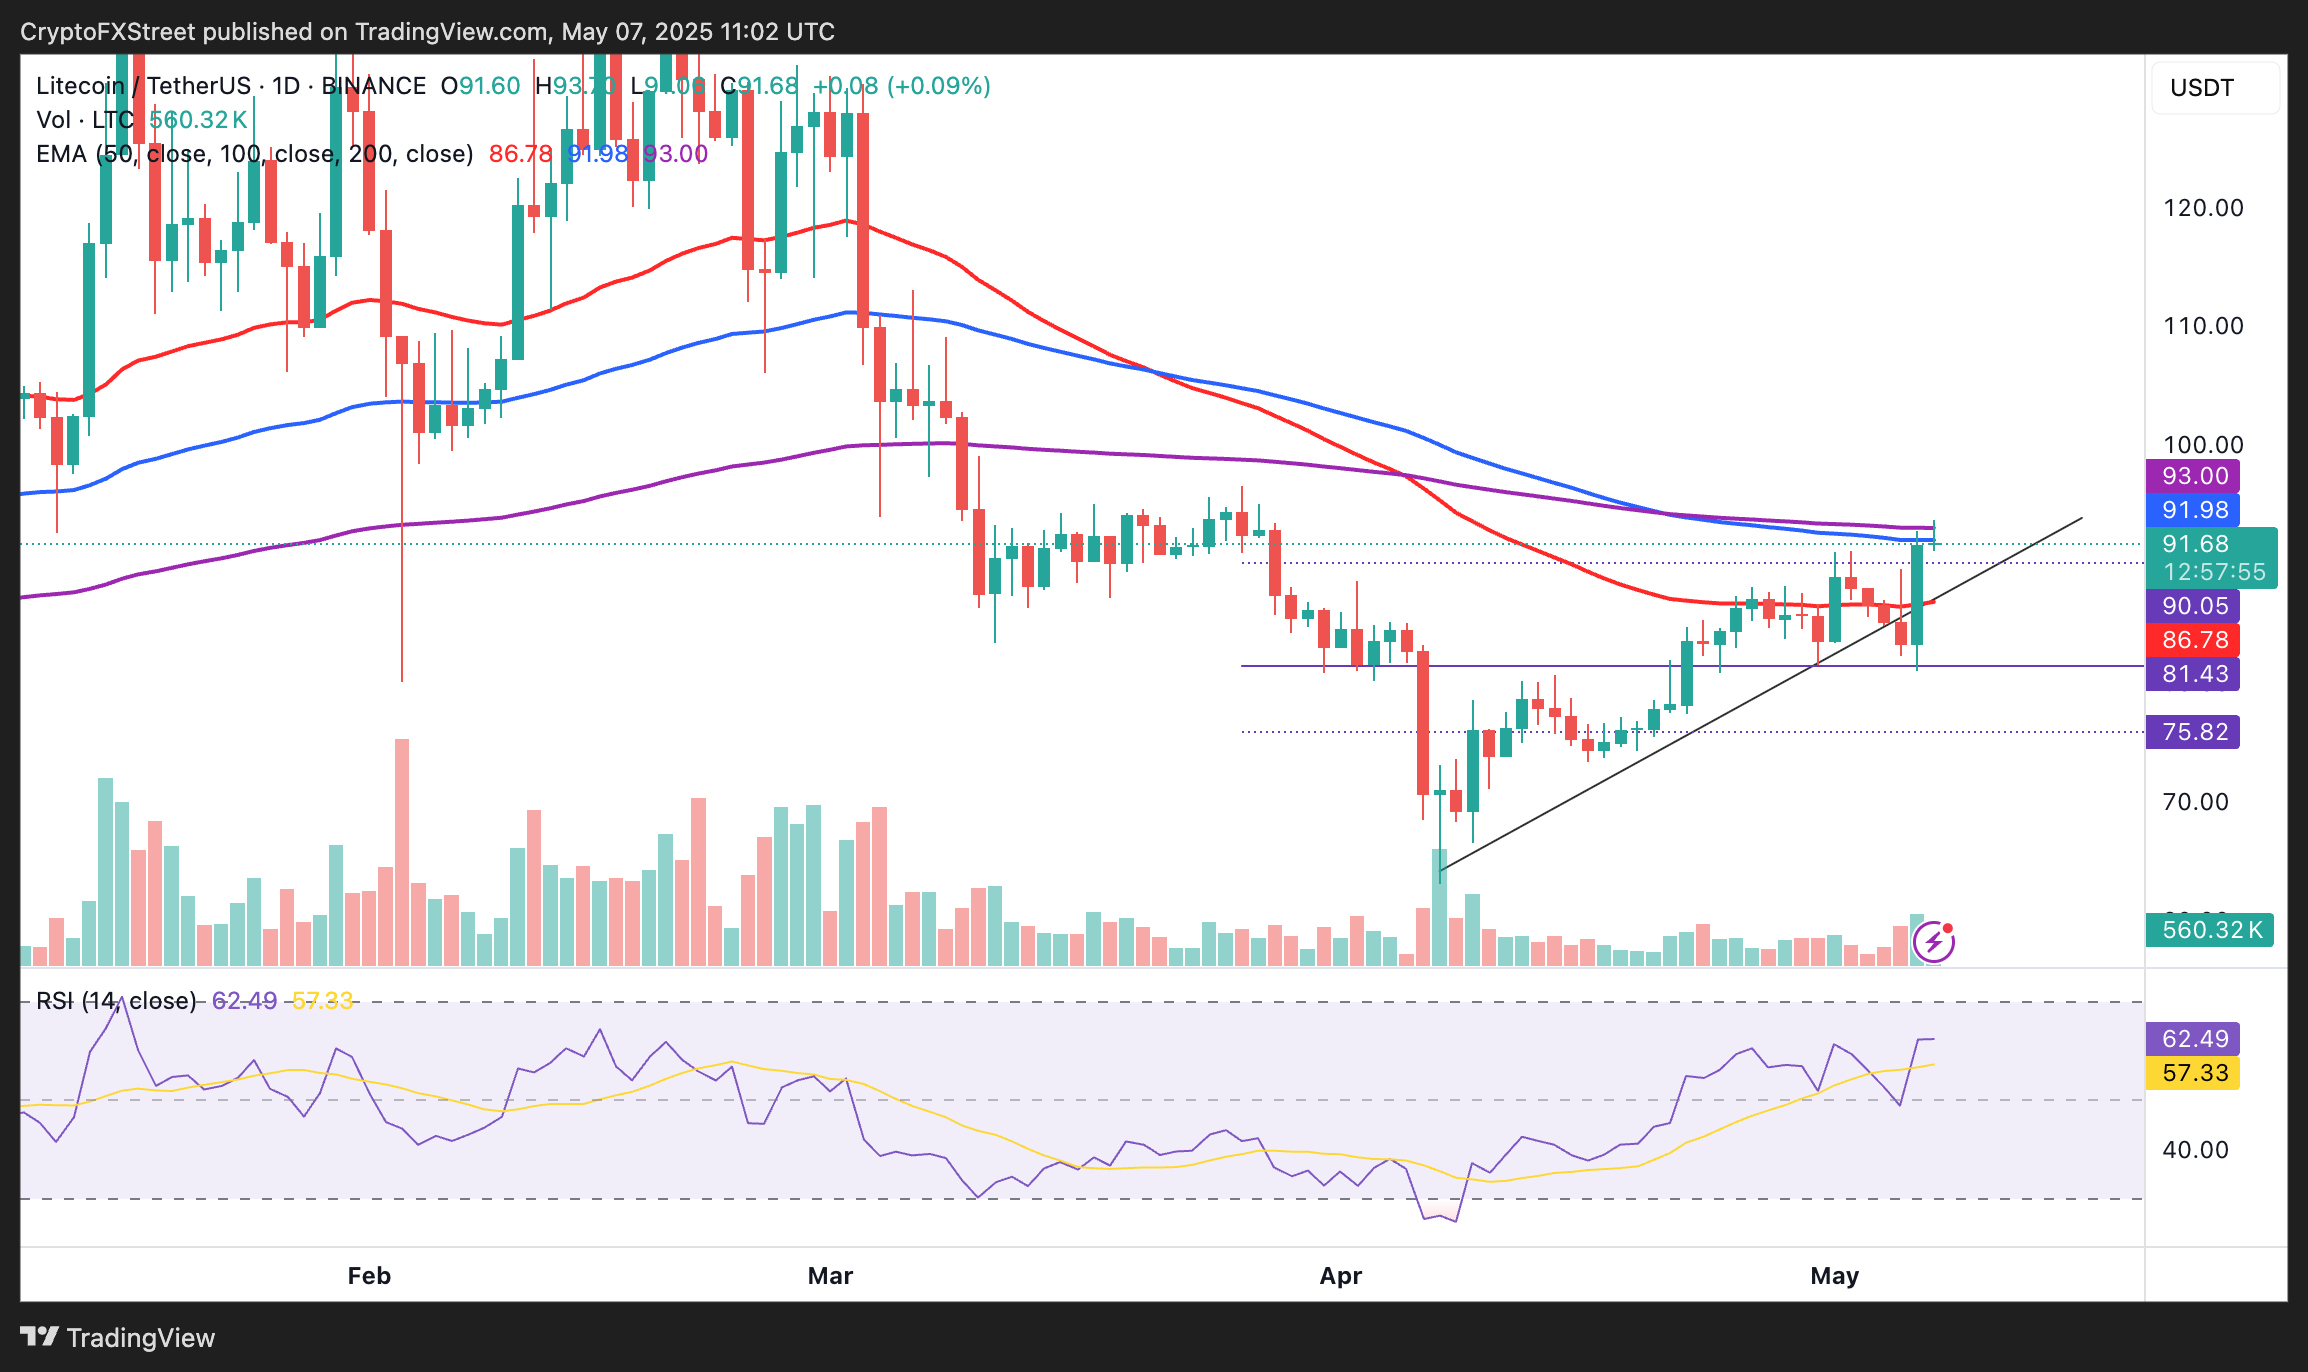
LTC/USDT daily chart
A bullish engulfing candle propelled Litecoin’s uptrend past $92 on Tuesday, a level not seen in 42 days. Now, LTC encounters resistance at $93, reinforced by the 200-day EMA.
The Relative Strength Index (RSI) indicator’s climb above the midline toward overbought territory highlights strong bullish momentum, boosting the odds of LTC hitting $100, a resistance last tested in early March.
A 17.73% surge in Open Interest (OI) reveals a significant influx of new positions in the Litecoin derivatives market. The uptick reflects growing trader interest, as OI measures the total number of outstanding contracts. It is plausible that traders are positioning for a run-up above $100 as Litecoin’s price gains bullish momentum.
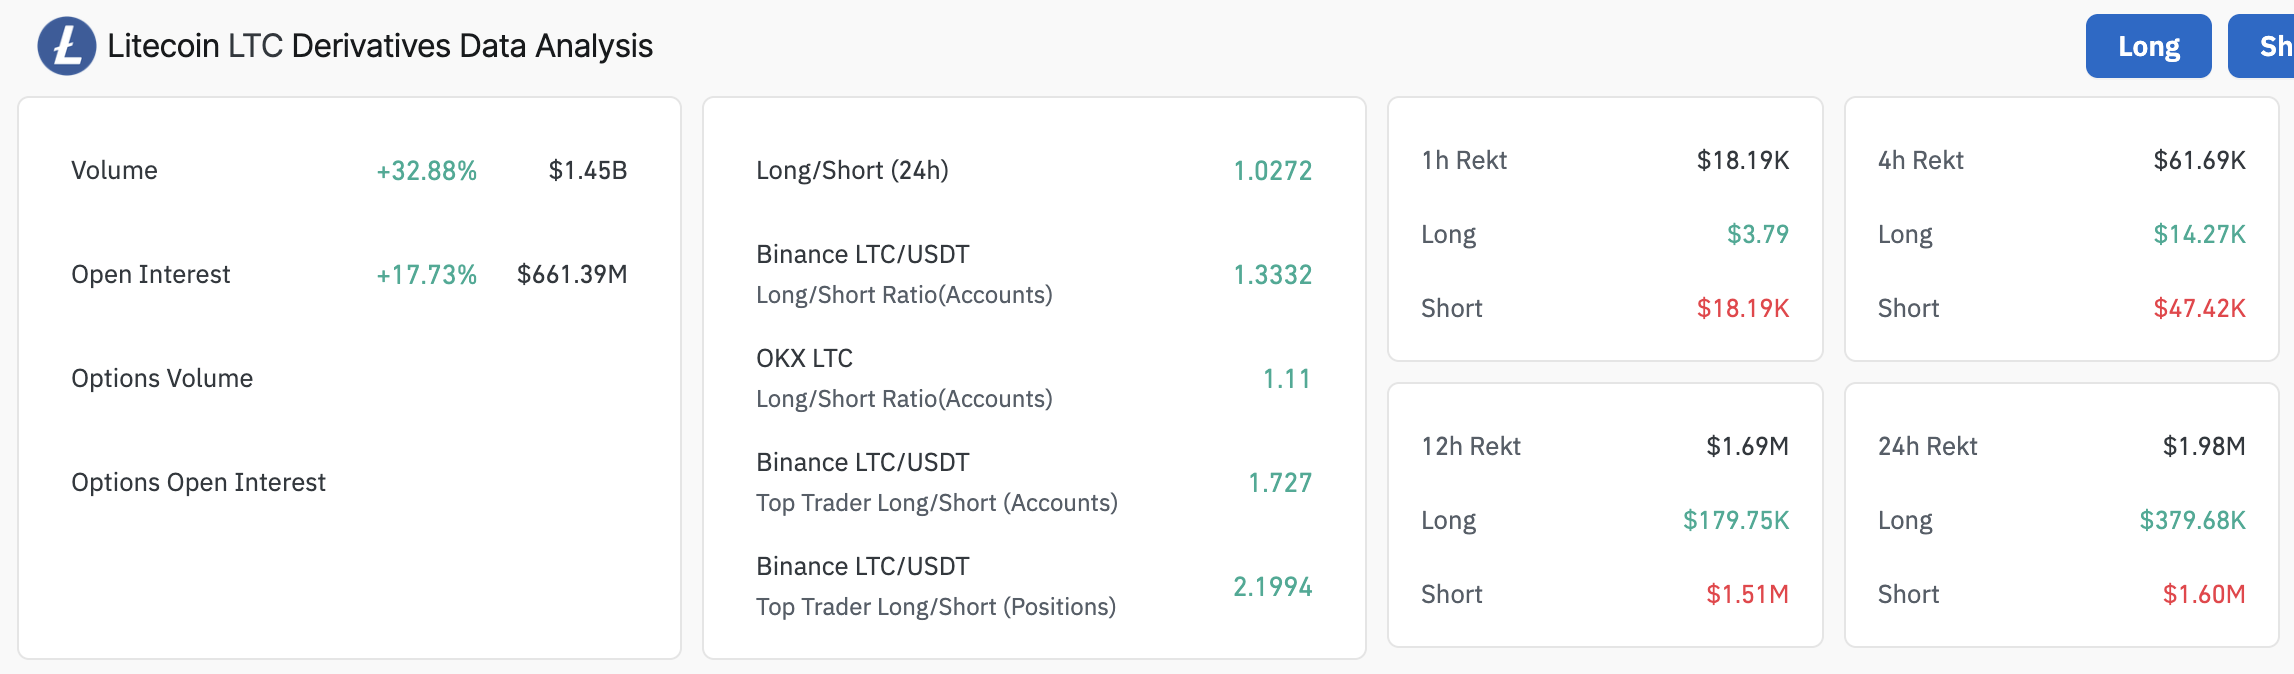
Litecoin derivatives data | Source CoinGlass
The chart above shows that the 32.88% increase in trading volume to $1.45 billion amplifies the OI surge. It suggests strong conviction among traders; moreover, liquidation data indicates a strong bias toward long positions.
Short liquidations ($1.60 million) have significantly outpaced long liquidations ($370,000) over the last 24 hours, mirroring a short squeeze, where price increases force short sellers to close positions. This adds upward pressure, as LTC approaches the resistance cluster between $92 and $95.
Litecoin’s uptrend encounters massive supply
Litecoin’s price is facing robust resistance in the region between $92 and $95, according to IntoTheBlock’s In/Out of the Money Around Price (IOMAP) on-chain metric. About 204,000 addresses that previously bought 6.83 million LTC in this range pose a challenge to the uptrend if investors decide to sell to break even.
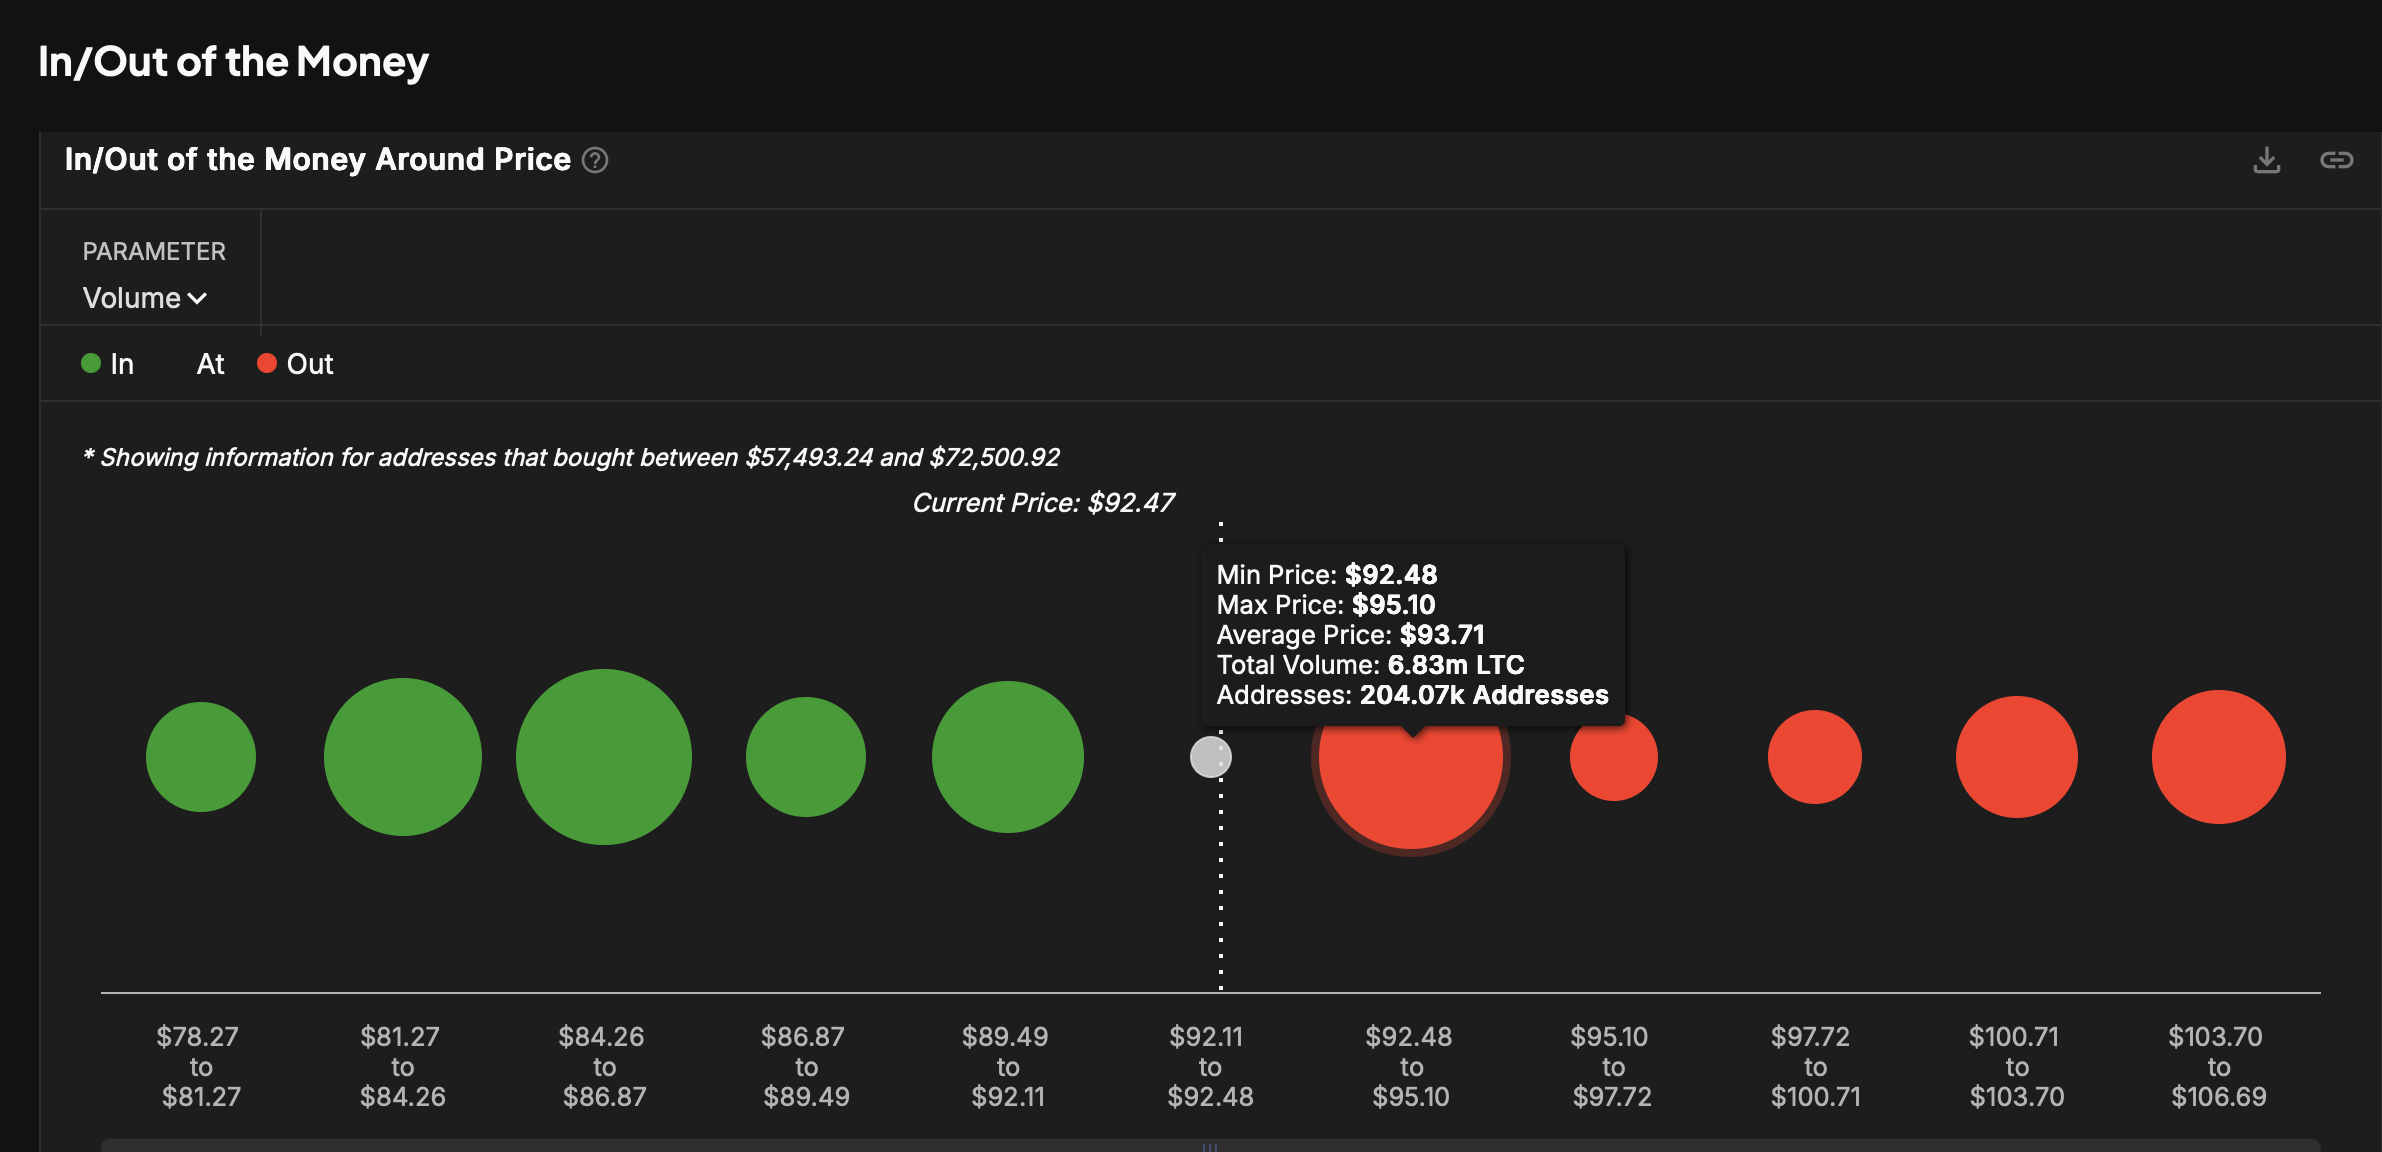
Litecoin IOMAP model | Source: IntoTheBlock
On the bright side, a break above the seller congested area at $92-$95 could accelerate Litecoin above the $100 hurdle. Besides, Litecoin sits on multiple demand clusters, as illustrated by the green circles in the chart above. In the event of a pullback below $90, traders would look for tentative liquidity-rich regions around $85 and $82, respectively.
Cryptocurrency metrics FAQs
The developer or creator of each cryptocurrency decides on the total number of tokens that can be minted or issued. Only a certain number of these assets can be minted by mining, staking or other mechanisms. This is defined by the algorithm of the underlying blockchain technology. On the other hand, circulating supply can also be decreased via actions such as burning tokens, or mistakenly sending assets to addresses of other incompatible blockchains.
Market capitalization is the result of multiplying the circulating supply of a certain asset by the asset’s current market value.
Trading volume refers to the total number of tokens for a specific asset that has been transacted or exchanged between buyers and sellers within set trading hours, for example, 24 hours. It is used to gauge market sentiment, this metric combines all volumes on centralized exchanges and decentralized exchanges. Increasing trading volume often denotes the demand for a certain asset as more people are buying and selling the cryptocurrency.
Funding rates are a concept designed to encourage traders to take positions and ensure perpetual contract prices match spot markets. It defines a mechanism by exchanges to ensure that future prices and index prices periodic payments regularly converge. When the funding rate is positive, the price of the perpetual contract is higher than the mark price. This means traders who are bullish and have opened long positions pay traders who are in short positions. On the other hand, a negative funding rate means perpetual prices are below the mark price, and hence traders with short positions pay traders who have opened long positions.
Author

John Isige
FXStreet
John Isige is a seasoned cryptocurrency journalist and markets analyst committed to delivering high-quality, actionable insights tailored to traders, investors, and crypto enthusiasts. He enjoys deep dives into emerging Web3 tren


