Litecoin price redefines momentum, as LTC approaches an impressive milestone
- Litecoin price triggers a falling wedge pattern, leading to a 33% gain over nine consecutive up days.
- LTC now illustrates a double bottom pattern, but heavy resistance may prevent a successful breakout.
- 2019 high of $146.00 resurfaces, raising doubts of the rally sustainability, despite impulsive rebound.

Litecoin price confirms breakout from the governing falling wedge pattern on July 25, marking a turning point for the altcoin and introducing new technical challenges. If the obstacles are overcome, the double bottom pattern projects a 30% gain for LTC in the weeks ahead.
Litecoin price to correct before engaging trifecta of resistance
Litecoin price may close today with nine consecutive up days, marking the first nine-day gain since 2017 and, as a result, establishing confidence in rally sustainability as LTC approaches a trifecta of resistance.
The origination of the rally coincided with a test of the 78.6% Fibonacci extension of the 2020-2021 advance at $108.23 and an oversold reading on the daily Relative Strength Index (RSI) on July 20.
The emerging trifecta of resistance includes the 50-day simple moving average (SMA) at $138.20, the 50-week SMA at $141.51 and the 2019 high of $146.00. The levels are now gaining relevance as Litecoin price battles the 50-day SMA. Moreover, the barrier formed by the three levels stands before the LTC double bottom trigger at $149.27.
Based on the run of nine consecutive up days and a gain of 30% in that period, combined with superior resistance, Litecoin price is highly likely to enter some form of corrective process. The corrective process could carry LTC to the upper line of the falling wedge at $119.80, leading to a 15% loss from the current price.
Any weakness below the trend line will suggest the rebound was a dead cat bounce and will invite a test of the 78.6% retracement level at $108.23. A failure at the retracement level exposes Litecoin price to a drop to the lower line of the falling wedge pattern, currently at $92.00.
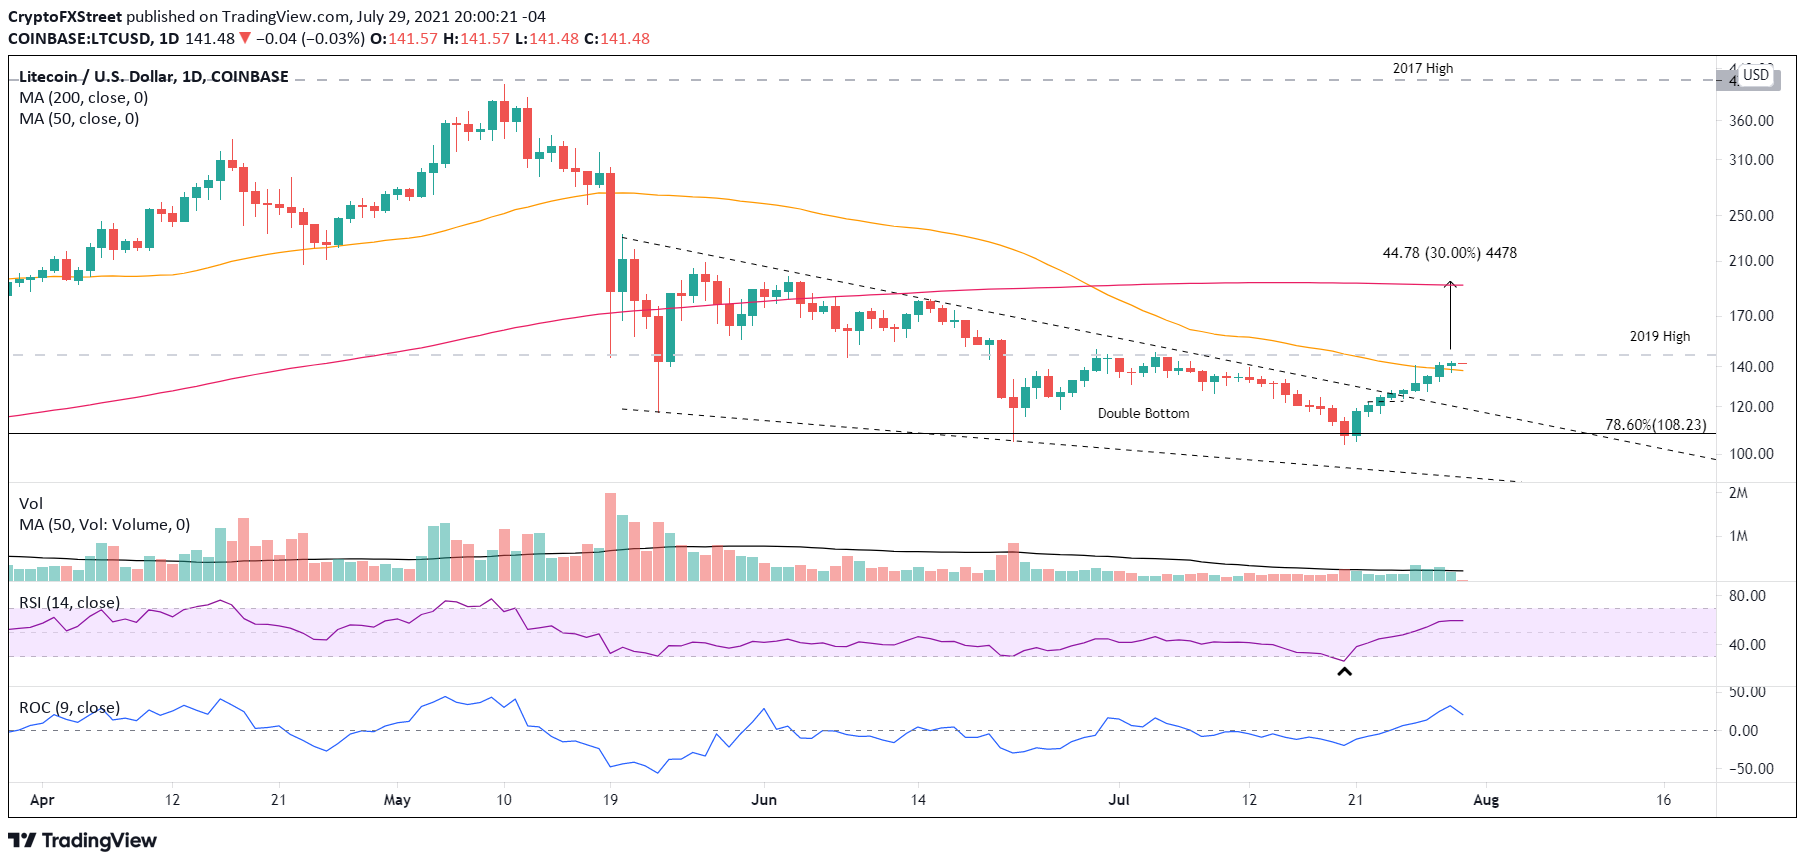
LTC/USD daily chart
Suppose the corrective process holds the wedge’s upper line. In that case, Litecoin price will have released the price compression generated by the initial rebound and positioned LTC for a successful breakthrough of the trifecta of resistance, and triggering the double bottom pattern framed by the June and July lows.
The measured move of the double bottom pattern is 30% from $149.26, indicating a profit target of $194.04. The profit target lies just above the 200-day SMA at $191.13.
The falling wedge signaled waning momentum to the downside. Litecoin price capitalized on the oversold condition to break out from the pattern and record nine consecutive days. Now, LTC needs to pause, but the foundation and momentum have been established to propel the digital asset through the double bottom trigger.
Author

Sheldon McIntyre, CMT
Independent Analyst
Sheldon has 24 years of investment experience holding various positions in companies based in the United States and Chile. His core competencies include BRIC and G-10 equity markets, swing and position trading and technical analysis.


