Litecoin Price Prediction: LTC eyes a 30% opportunity
- Litecoin price closed last week with a 9.81% gain and finished July up 0.05%.
- LTC has defined a double bottom pattern, but it may be plotting a handle after failing to close above $149.26.
- The 50-week simple moving average (SMA) at $143.15 and the 2019 high of $146.00 combine to form fierce resistance.

Litecoin price responded to the oversold condition on the daily Relative Strength Index (RSI) with a 35.71% rally over the next ten days. It was an impulsive response, but LTC failed to trigger the double bottom with a daily close above the midpoint of the base at $149.26. As a result, the cryptocurrency has been coiling along the 50-day SMA, shaping a handle to go with the double bottom. A resolution of the pattern to the upside reveals a 30% opportunity for investors.
Litecoin price waits for a second opportunity
Litecoin price closed positive ten consecutive days from July 21 to July 30, marking the first ten-day gain since 2017 and creating the confidence that LTC had established a firm correction low on July 20.
Since the burst higher, Litecoin price has been consolidating along the 50-day SMA at $134.89, preparing for a second chance to strike a daily close above the double bottom trigger of $149.26. For some, the consolidation could be identified as a handle of the larger double bottom price structure. Either way, LTC is holding steady.
In front of a successful LTC breakout from the double bottom is the resistance framed by the combination of the 50-week SMA at $143.15 with the 2019 high of $146.00.
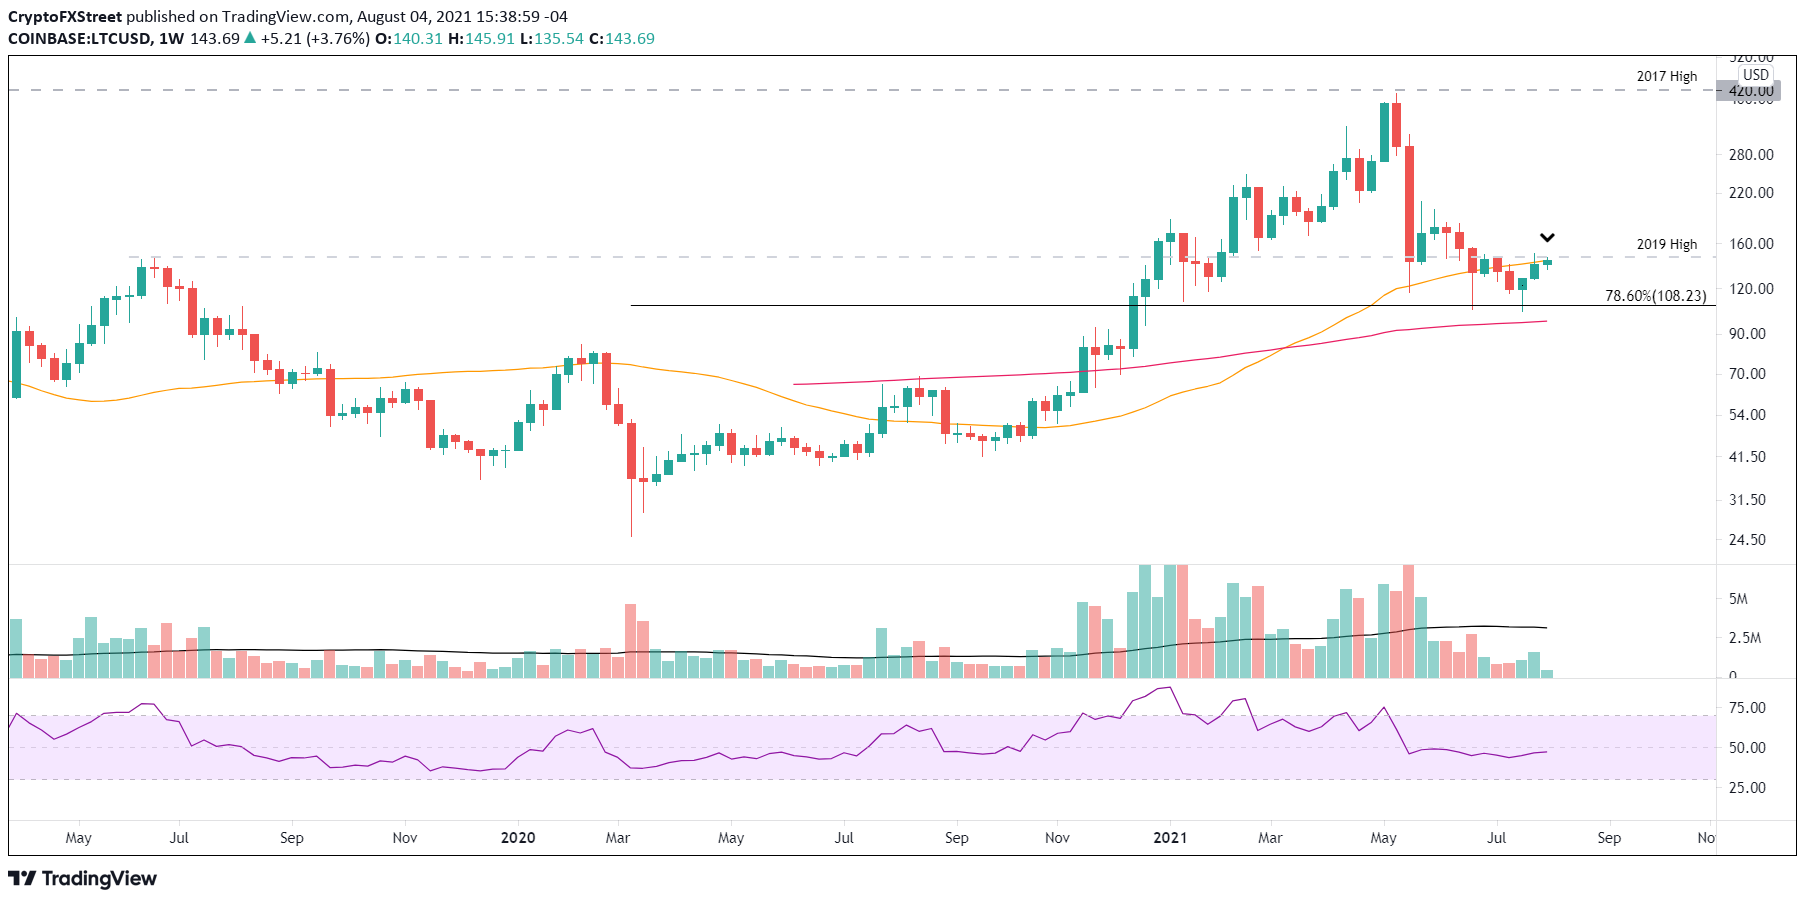
LTC/USD weekly chart
To resume the rally and forge a trend to the 200-day SMA at $191.09, Litecoin price needs to register a daily close above $149.26. It would confirm the double bottom pattern, but it would also free LTC from the intimidating resistance announced by the convergence of the 50-week SMA with the 2019 high. It is the barrier that stands in front of tremendous upside potential for the altcoin.
If Litecoin price successfully overcomes the resistance and activates the pattern, it should see a quick rally to the 200-day SMA at $191.09, delivering a 28% return to timely LTC market operators. An additional upside target is the 38.2% Fibonacci retracement of the May-July at $222.40.
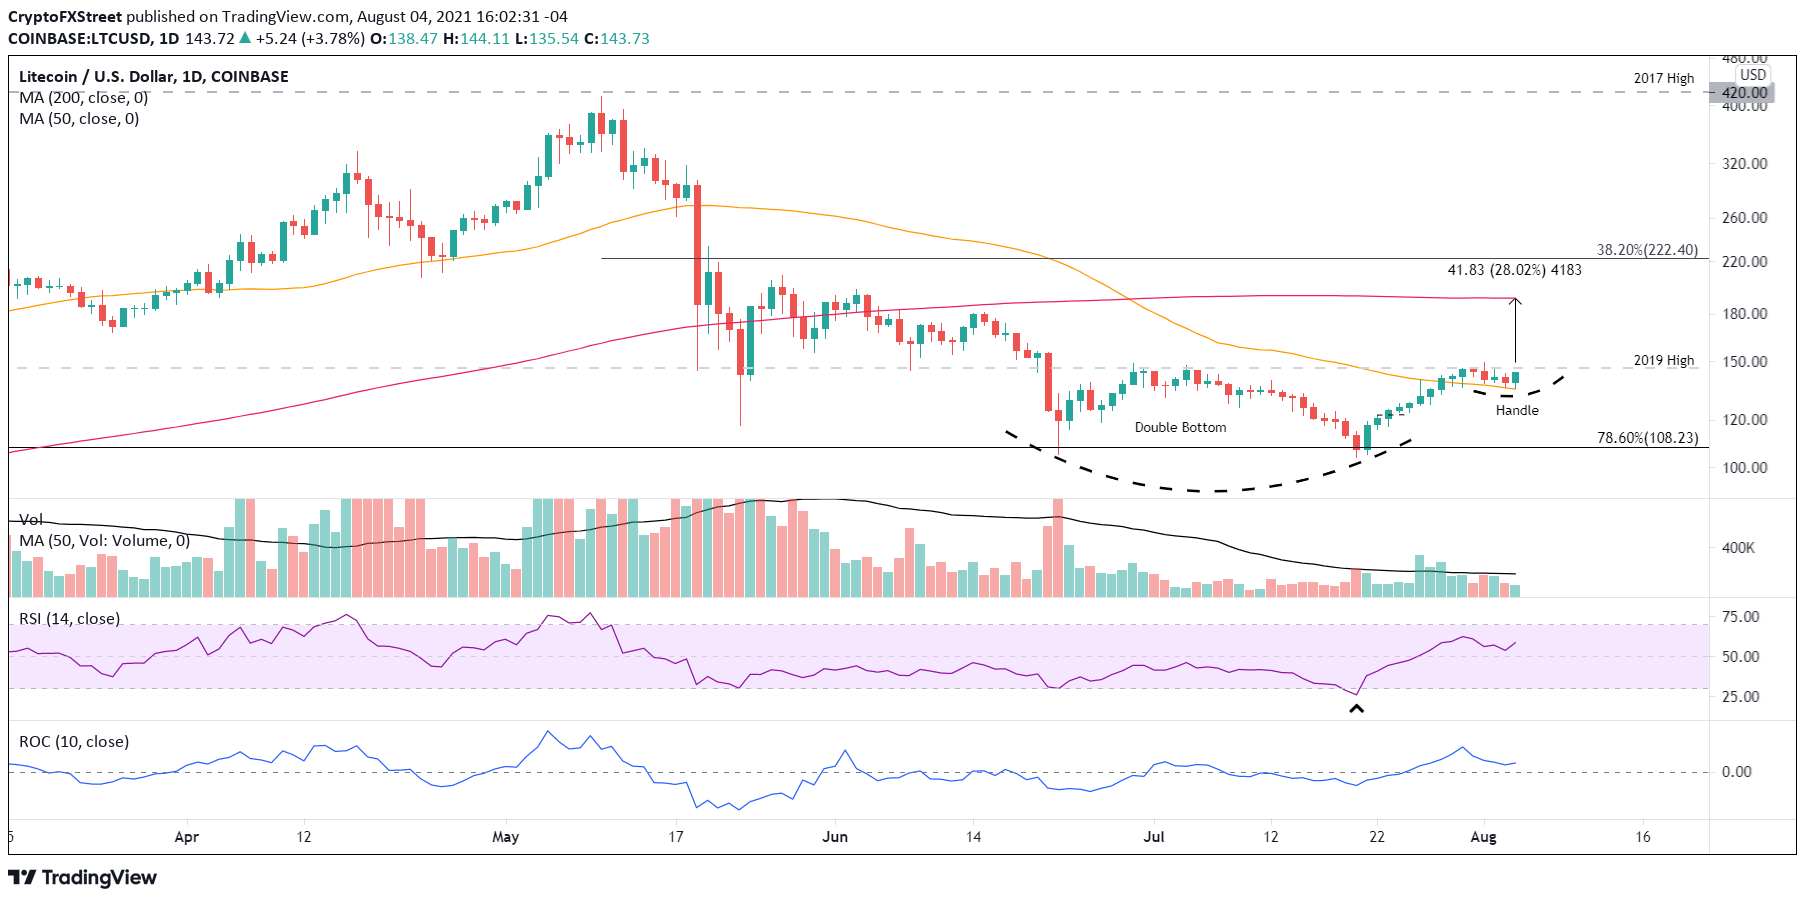
LTC/USD daily chart
On the downside, if Litecoin price cannot limit the consolidation to the 50-day SMA, it should not fall below $127.43. A close below the level will increase the probability that LTC will test the 78.6% retracement level of the 2020-2021 advance at $108.23. A bearish cryptocurrency market could take the altcoin down to the July low of $104.02, confirming the rally as an oversold bounce.
Litecoin price is positioned for a bullish outcome, but until the double bottom triggers, it is a strategy of patience and keeping an eye on the prize.
Author

Sheldon McIntyre, CMT
Independent Analyst
Sheldon has 24 years of investment experience holding various positions in companies based in the United States and Chile. His core competencies include BRIC and G-10 equity markets, swing and position trading and technical analysis.


