|

Litecoin price analysis: LTC/USD stares into the abyss; upside capped under $66

  • Litecoin price smashed through the $70 support like an explosive device in the mines.  
  • Technical indicators: Recovery is possible but the resistance at $66 will be a hard nut to crack.

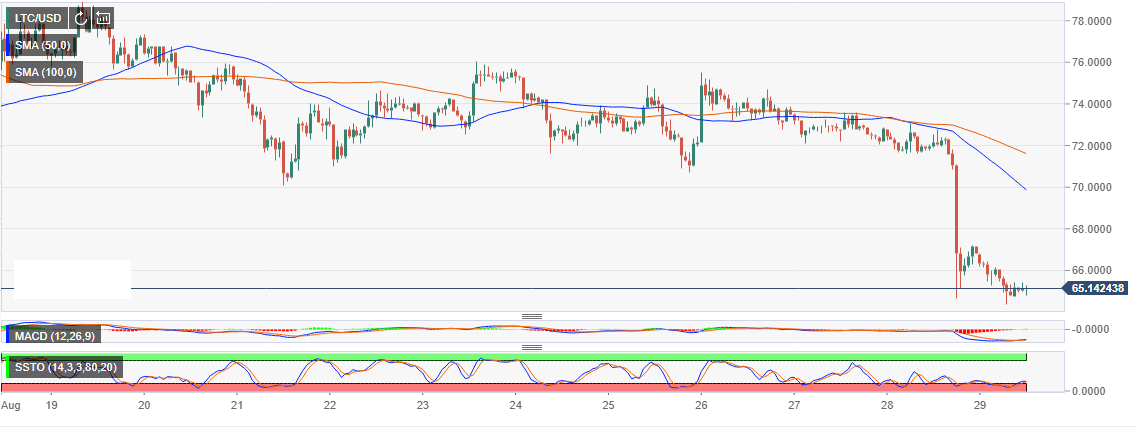
Litecoin dropped like a dead weight in the air after a bearish wave destabilized the majority of the top 100 cryptocurrencies. In tandem with Bitcoin which plunged under $9,500, Litecoin smashed through the $70 like an explosive device in the mines.  

Prior to the dropped, there was a sideways consolidation move above $70. Moreover, the price remained pivotal at both the 50 Simple Moving Average and the 100 SMA in the one-hour range. Similarly, upward movements had been capped under $76 leaving $70 vulnerable to declines.

At the moment $64 seems to be the most viable support in the short-term. Indicators show that recovery is possible but the resistance at $66 will be a hard nut to crack. The Relative Strength Index (RSI) hit extremely oversold levels. However, a recovery above 30 suggests that the trend has a bullish inclination. Besides, the Moving Average Convergence Divergence (MACD) has a minor positive divergence. This means that buying pressure is gradually creeping back into the market.

LTC/USD 1-hour chart
Author

John Isige

John Isige

FXStreet

John Isige is a seasoned cryptocurrency journalist and markets analyst committed to delivering high-quality, actionable insights tailored to traders, investors, and crypto enthusiasts. He enjoys deep dives into emerging Web3 tren


More from John Isige
Share:

Editor's Picks

XRP extends decline as muted on-chain activity, bearish technicals weigh

Ripple (XRP) continues to trade under heavy selling, trading below $1.10 at the time of writing on Wednesday. The remittance token marks four consecutive days of declines, weighed down by geopolitical tensions and significantly low risk appetite.

Crypto Today: Bitcoin, Ethereum, XRP extend technical weakness amid escalating tensions in the Middle East

Cryptocurrencies are broadly extending declines on Wednesday, after last week’s recovery. The sell-off has seen Bitcoin (BTC) slide below $62,000, increasing downside risks toward the next key support at $60,000.

Solana nears key support zone as bears aim for a 20% downside

Solana price is down 3% on Wednesday, extending a bearish reversal after an overhead trendline capped the previous week’s recovery. Institutional inflows eased to $1.67 million on Tuesday, while declining Open Interest and fluctuating funding rates indicate mixed retail demand.

Hyperliquid extends losses as retail demand fades

Hyperliquid (HYPE) slips below $70 on Wednesday, extending a steady decline so far this week. A broader market risk-off sentiment weighs down on the retail support for HYPE despite steady institutional demand, with $4.32 million in inflows on Tuesday.

Bitcoin: Quarter-end rebalancing might fuel BTC next bullish move
Bitcoin (BTC) is up over 3% so far this week, trading above $61,800 at the time of writing on Friday after slipping to a 21-month low earlier this week. Institutional selling continued, with spot Exchange Traded Funds (ETFs) recording net outflows of over $520 million through Thursday, pointing to the eighth consecutive week of withdrawals.

